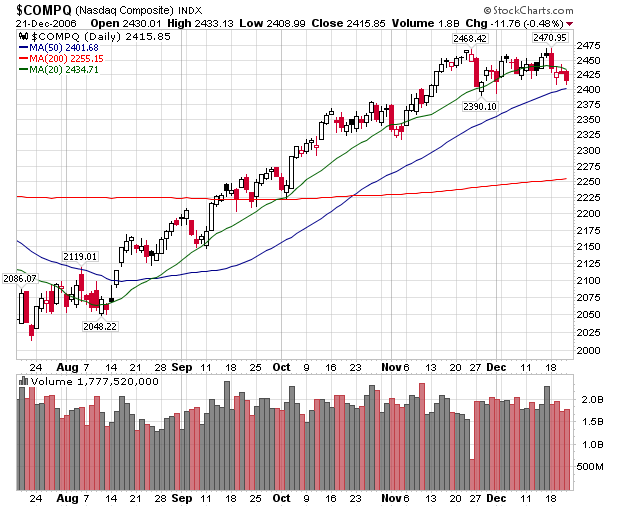
As we get closer to the year end, it's time to look at charts from a standpoint of what happened in 2006 and what may happen in 2007. Fund managers have a new year in which they have to at least beat the averages' gains and hopefully do better (although most don't). When looking at the NASDAQ chart (courtesy of Stock Charts), notice it
may be forming a double top. The first top occurred at 2468 and the second at 2470. In addition, it's closed below the 20 day simple moving average four days in a row. The last time the NASDAQ traded below the 20-day SMA was in early November. But the market was in a much stronger up-trend then. Now the market is trading sideways. The 20 day SMA is now trending down. Volume has also been a tad light. Finally, the NASDAQ has had a great run from early August of this year. All things must come to and end.
Below the NASDAQ chart is a chart from Marketguage that shows the 5-day up/down volume ratio. The indicator is neutral right now.
Just remember, technical analysis is not a science. We're looking at
probabilities here.