"I don't think we've seen the bottom," said David Berson, chief economist for Fannie Mae. "We're going to see a much bigger drop in investor demand this year. But by the second half of the year the market will stabilize, if investors pull out quickly."
Berson said he expects the home-price index calculated by the Office of Federal Housing Enterprise Oversight will show a nationwide decline in values for 2007, the first time that will have happened since the data began being collected in 1975. Unlike other measures, the OFHEO data measure the price changes on the same homes over time, meaning the index is less likely to be skewed by the types and locations of sales.
"It won't be a big decline, maybe 1%. And the declines will be far more centered in areas that have had the most investor activity," he said. "Real home-price gains, adjusted for inflation, will be negative this year, next year and possibly the year after that."
One of the big problems with national housing statistics is they group low-activity areas with high-activity areas. So the national number includes Boise Idaho and Southern California. These two areas are not comparable, but we lump them together in the national number. However, that means a drop at the national level would be pretty severe because the hot areas are seeing a large enough drop in price to lower the national, macro-statistic.
It's also very telling that the statistics have not declined in 30 years.
The biggest problem the housing market faces is "a seriously large inventory situation," said David Seiders, chief economist for the National Association of Home Builders, which is hosting the International Builders Show here this week. Seiders said the housing boom in 2004 and 2005 produced at least 400,000 more housing units than demand could support, and builders are having to push hard to move those homes off the market.
There is a ton of inventory on the market right now. The amount of vacant houses on the market is at record levels by a large margin.
Here's a weekly chart of the homebuilders ETF from Stockcharts:
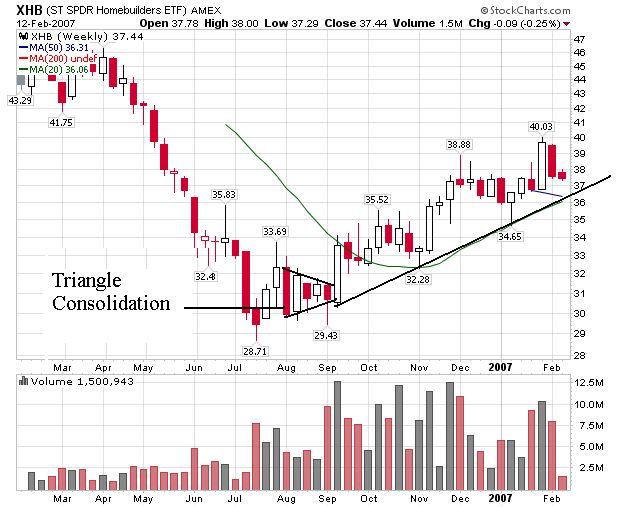
The sector consolidated in a triangle bottom in August before participating in the last 2006 rally. Here's a closer look at the late 2006 rally.
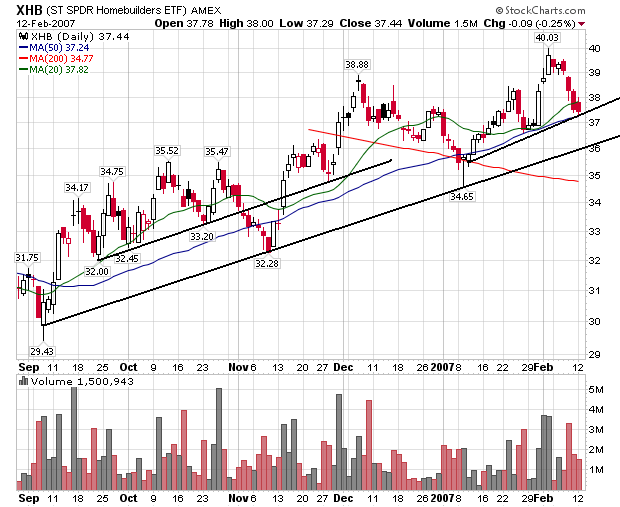
We have a primary trend ling with a few minor supporting trend lines. There was an article in the latest edition of Barons asking of the homebuilders rally had run its course. We'll have to wait and see how that plays out.