A big drop in China started it off:
The Shanghai Composite Index, which surged an astonishing 127% in 2006 and is up 13% over the last six sessions, plunged 8.8% -- the biggest one-day decline in 10 years. Worries the Chinese government may step up its efforts to curb speculative buying interest have been attributed to the consolidation that has aggravated ongoing concerns about overbought conditions and talks of a correction.
Here's more from Bloomberg:
China's stocks tumbled the most in 10 years on concern that a government crackdown on investments with borrowed money will end a rally that drove benchmarks to records.
...
The Shanghai and Shenzhen 300 Index slid 250.18, or 9.2 percent, to 2457.49. The measure, which jumped 13 percent in the past six sessions, closed at a record yesterday.
Today's rout wiped out $107.8 billion from a stock market that doubled in the past year as 249 of the key index's 300 shares plunged by the 10 percent limit. The 300 index is valued at 38 times earnings, compared with 16 times for the Morgan Stanley Capital International Emerging Markets Index.
The State Council, China's highest ruling body, has approved a special task force to clamp down on illegal share offerings and other banned activities in the market, the government said. The group will provide advice on regulations and policy explanations of the securities market, according to a statement published Feb. 25 on the central government's Web site.
I can't speak to the practices these proposed regulations are supposed to curb. However, I would assume they are a problem for the Chinese market.
Other developing countries sold-off in sympathy with China. The ETF for Malaysia was down 9%, Brazil was down 8.59%, Mexico was down 8%, and Singapore was down 7.8%.
So at the open, there was a rolling worldwide sell-off going on starting in Asia.
In the US, the big drop in durable goods that came out before the open added fuel to the bears fire.
Orders for durable goods decreased by 7.8% last month to a seasonally adjusted $203.90 billion, the Commerce Department said Tuesday. Durables rose 2.8% in December, revised from a previously estimated 2.9% increase.
A key barometer of business-equipment spending -- orders for nondefense capital goods excluding aircraft -- fell by 6.0%, after increasing 3.6% in December. Shipments for nondefense capital goods excluding aircraft decreased by 2.7%, after dropping by 0.8% in December; the shipments are used in calculating gross domestic product.
The 7.8% decrease in overall durable goods orders surprised Wall Street. The median estimate of 21 economists surveyed by Dow Jones Newswires had durables just 3.2% lower in the first month of 2007.
The manufacturing sector weakened in 2006. The economy had cooled and receding demand caused inventories at companies to pile up. Firms had to adjust inventory levels and depleting supplies meant fewer orders and cuts in production of goods. The auto business was hit particularly hard. The Federal Reserve recently reported industrial production made a surprising drop in January, falling by 0.5%.
So, before the US markets opened, the Asian markets tanked and there was bad economic news.
Here is daily chart of the SPY.
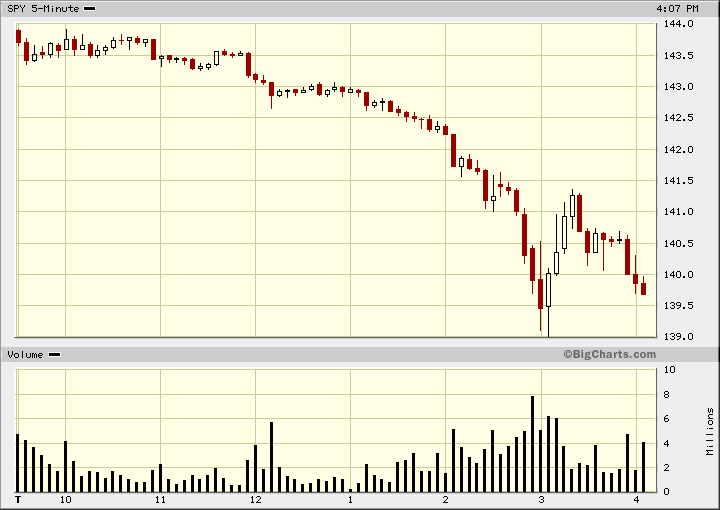
Notice this chart closed near the low point of the day and the last bar had big volume. There was one bounce about 3 PM. This chart says essentially one thing: the bears were in complete control of the day.
Here's a daily chart of the SPY's
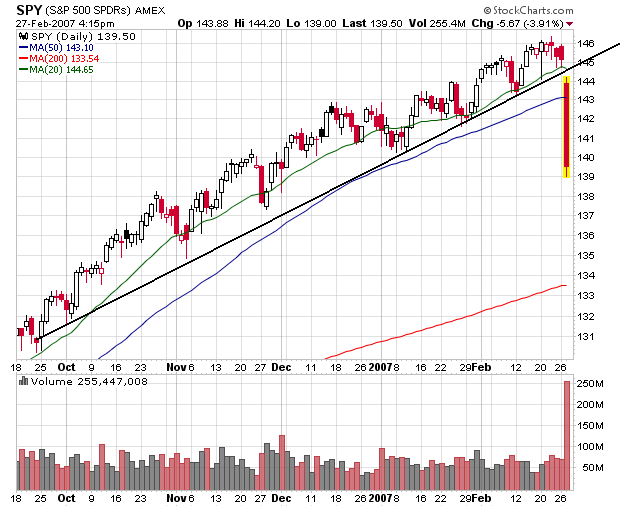
In one day the average broke through the uptrend and went through the 20 SMA and 50 SMA on enormous volume.
Here's a 5-minute chart of the QQQQs
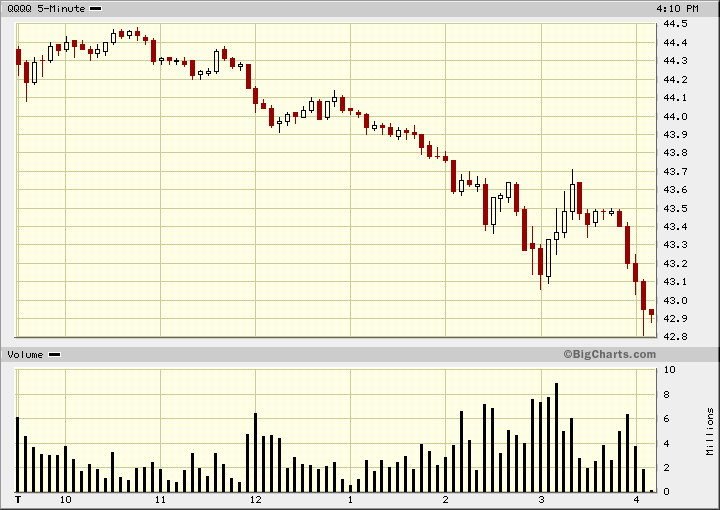
Like the SPYs, the QQQQs saw one bounce. They closed on the low point, although volume was weak on the last sell-off.
Here's the daily chart for the QQQQs
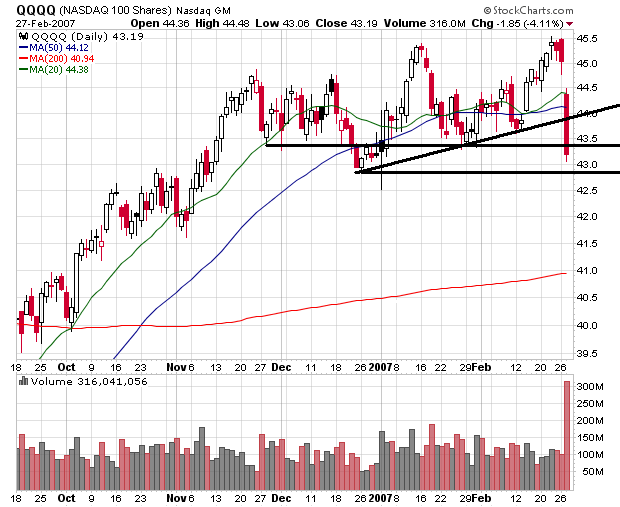
There was less technical damage on this chart -- although the damage is still pretty big. The QQQQs have been trading in a range since the end of November. Today we started near the top of the range and closed near the bottom on enormous volume.
Here's the daily chart of the IWNs
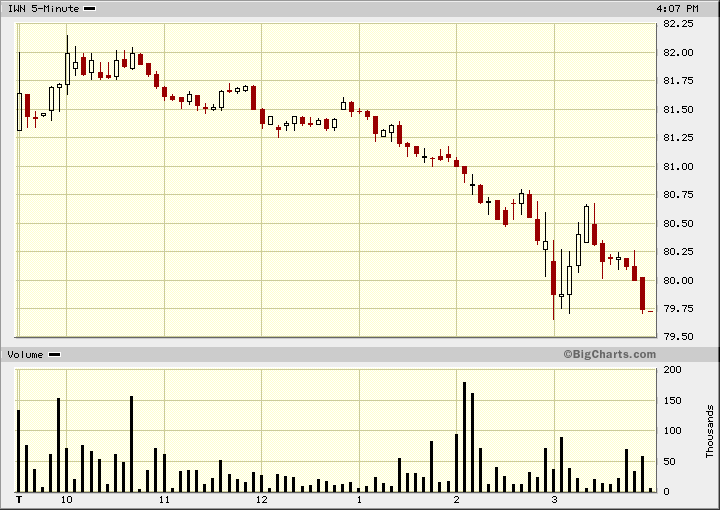
Like the other two averages we've looked at, there was one bounce. The index closed at the low point of the day, although the volume was weak.
Here's the daily chart of the IWN.
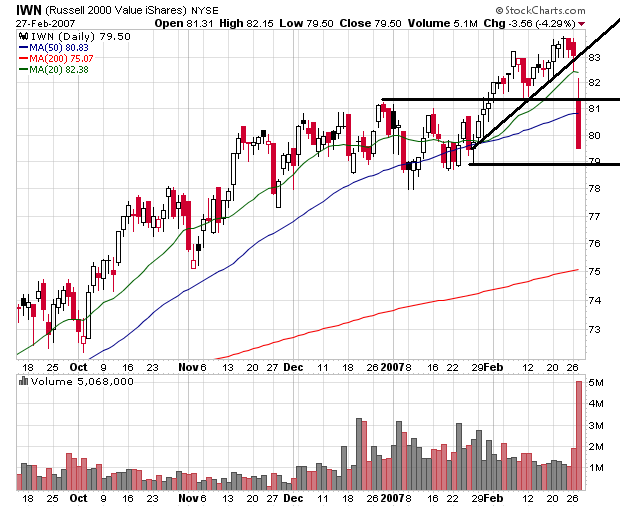
This index was rallying well until today. However, we broke through the uptrend, 20 and 50 SMA on enormous volume.
So, here's the summation.
All of the indexes dropped hard on big volume. They have all broken uptrends and moved through their respective 20 and 50 day SMAs.
All of the various sectors were down big as well. This sell-off spared no one. Basic materials (XLB)- down 3.17%, Financials (XLF) down 4.67, Energy (XLE) down 1.95%, Consumer Staples (XLP) down 3.06%, Health Care (XLV) down 3.04%, Consumer Discretionary (XLY) down 3.39% and Utilities (XLU) down 1.32%.
These are the kind of days that turn trends around. The bottom line is the volume indicates everybody was looking for the door today. The breaking of trend lines indicates a reversal occurred, further confirmed by the huge volume totals. The SPYs are clearly moving lower. The QQQQs need to move through 43.5 or so and the IWNs need to move through 78.60 for there to be a real break. But given today's action, we could have further drops tomorrow.