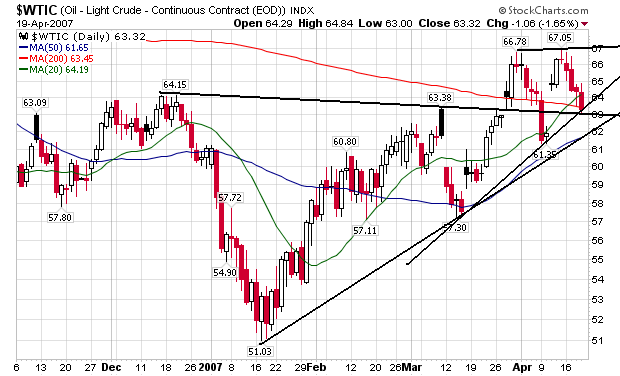
Notice the following points.
1.) The uptrend started in mid-January is still intact.
2.) The average is still above the support line drawn from mid-December to early March. This is the neckline of a head and shoulders pattern. Prices are just above this line right now, so we'll have to see how the average reacts to this line of support.
3.) The average has formed an ascending triangle pattern from mid-March to the present. That means we have lower bottoms which is usually a bullish indicator.
4.) The 20 and 50 day SMA are still trending up.
The fundamentals are still bullish. Demand is increasing and OPEC has successfully limited production. The US is starting the summer driving season and gas prices are already higher than at the same time last year.