Here's the daily chart:
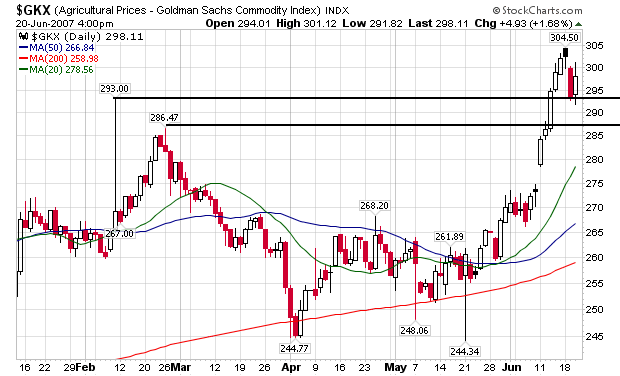
Prices have spent the last 3-4 months consolidating right around the 260 level. But they have increased since then, moving above resistance at 293. All of the moving averages are rising. However, the price level is pretty far above the 20 day SMA. This implies the market may consolidate or move back to those levels.
Here's the weekly chart:
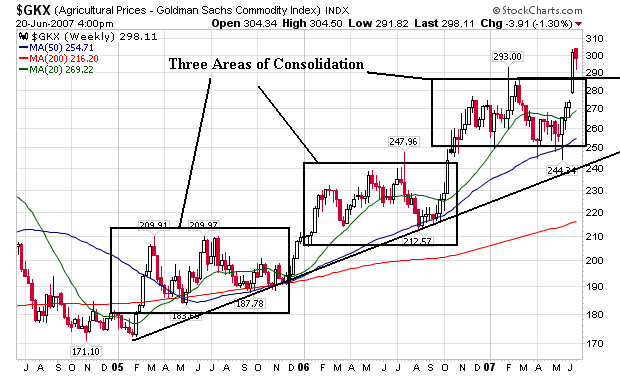
Notice there are three areas of consolidation that last at least nine months each. These provide a solid area of support for the moves upward. Also note the 50 and 200 day SMA are moving up. The 20 day SMA is also increasing, but that indicator has stalled in a range right now.
Short version -- agricultural prices are increasing. And there are a lot of technical and fundamental reasons for this increased to at least remain the same or move higher.