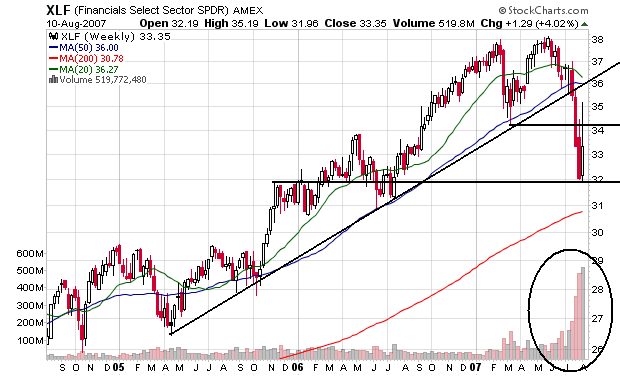
Financials:
This sector is technically in terrible shape. They broke a two and a half year uptrend in late June/early July. They have been droppinig on heavy volume ever since. The average is below the 20 and 50 day Simple Moving Average (SMA). They have another point to go before hitting the 200 day SMA (roughly 3%). In addition to the technical problems, this sector has some serious fundamental problems. In other words, this sector isn't going to recover anytime soon.
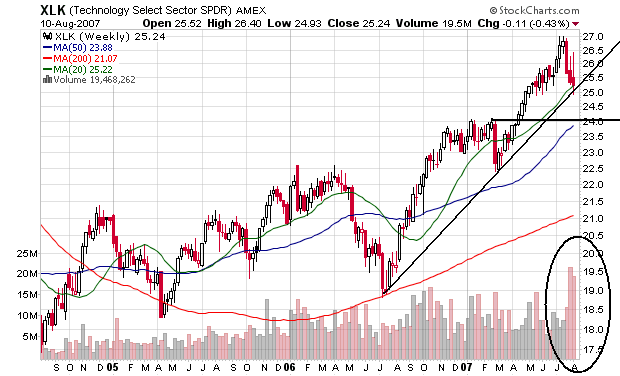
Technology
This is one of the favorite market areas of the blog Between the Hedges. This market is currently at the trendline of a year long rally. The average is also at the 20 day SMA, adding further support. Despite the volatility in the market, this sector has held up pretty well -- it dropped hard three weeks ago, but the drop has lessened over the last two weeks. All three moving averages are still moving up. Despite the heavy volume, the average is still holding to the trend line. The average has support right around 24.
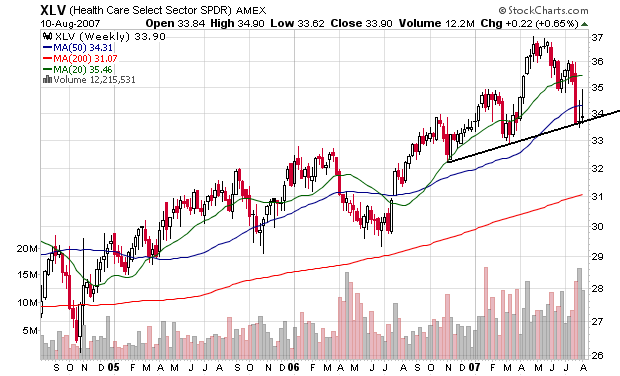
Health Care
Health care is in a mini-rally that started late last year. The average took a big hit earlier this month but is now hugging the trend line. All three moving averages are still trending up, although the average is below the 20 and 50 SMA which will pull the SMAs down a bit. The sector has support at $33 and a little below.
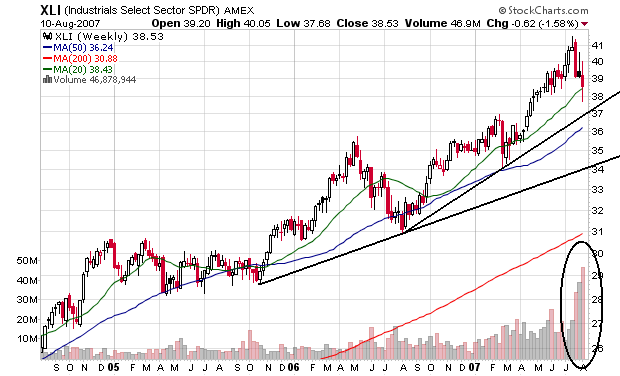
Industrials
Industrials are the beneficiaries of global infrastructure investment and a weak US dollar. We have two upward slanting trend lines: one that started in late 2005 and a steeper one that started in mid-2006. All three moving averages are still moving up and prices are trading right at the 20 day SMA. Despite heavy volume on the sell-off of the last three weeks, prices are still at the trend line. The average has support at the 20 day SMA and right around the $37 level.
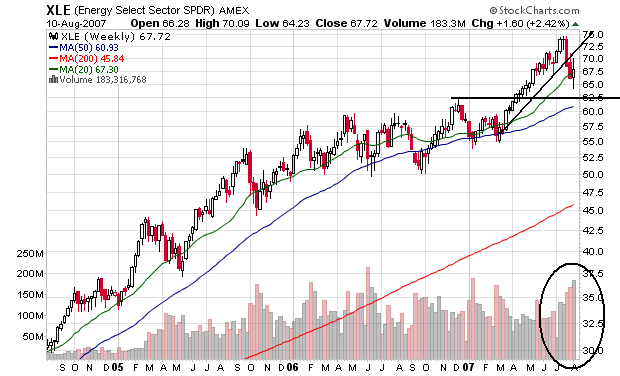
Energy
Energy had a mini-rally that started in March 2007. It has broken the trend but is now at the 20 day SMA. The sell-off over the last three weeks has occurred on heavy volume, but the average is still right at the 20 SMA. While there is about 3%-5% downside, there is a ton of support in the $57 to $62 area.