Wal-Mart Stores Inc. and Home Depot Inc., the two largest U.S. retailers, said the housing slump, rising mortgage defaults and high energy prices will depress earnings for the year.
``U.S. consumers continue to be under difficult pressure economically,'' Wal-Mart Chief Executive Officer H. Lee Scott said on a recorded call today. ``It is no secret that many customers are running out of money toward the end of the month.''
Wal-Mart, the world's largest retailer, fell $2.29, or 5 percent, to $43.88 at 12:32 p.m. in New York Stock Exchange composite trading for the biggest drop since July 2002. Home Depot fell $1.02, or 2.9 percent, to $34.22. They have declined 15 percent this year.
....
Home Depot Chief Executive Officer Frank Blake said today that the U.S. home-improvement market will ``remain soft'' due to slowing home sales and declining house prices.
Second-quarter net income fell to $1.59 billion, or 81 cents a share. Revenue dropped 1.8 percent to $22.2 billion, the first decline in four years.
Excluding the company's HD Supply unit, earnings were $1.52 billion, or 77 cents a share. On that basis, analysts estimated 73 cents. Sales were predicted to be $22.6 billion.
Sales in stores open at least a year decreased 5.2 percent, the fifth straight decline.
Wal-Mart is by far the largest discount retailer, with a market cap of $189 billion. The next largest is Target with a market cap of $53 billion. According to Wal-Mart's latest annual income statement, they did $348.6 million in sales. Bottom line -- they're a really big company and what they say about the consumer is very important and relevant financial information.
Home Depot is the largest home building store with a market cap of $70 billion. They are almost twice as large as their nearest competitor Lowe's whose market cap is $41.8 billion. According to their latest annual income statement, HD had $90 million in annual revenue. Again -- what they say about the consumer is very important.
Let's relate this to the overall economic picture.
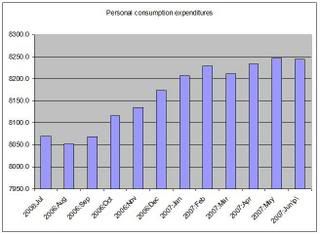
Here's a graph of the last few months reports of personal consumption expenditures from the Bureau of Economic Analysis. These figures are the seasonally adjusted annual rate in 2000 chained dollars. Notice that the figures haven't really moved much in the last 5 months.
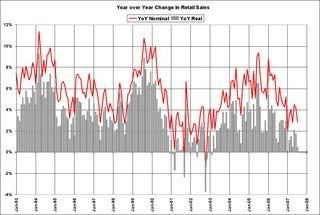
Here is a chart of year-over-year annual change in retail sales from the blog Calculated Risk. The gray bars are retail sales adjusted with the personal consumption deflator. Notice the trend is down both for teh adjusted and unadjusted numbers.
In the latest GDP report, Personal consumption expenditures increased 1.5%. This falls under the luke-warm heading -- not great but not bad. However, it does indicate the consumer is slowing down in his spending for now.