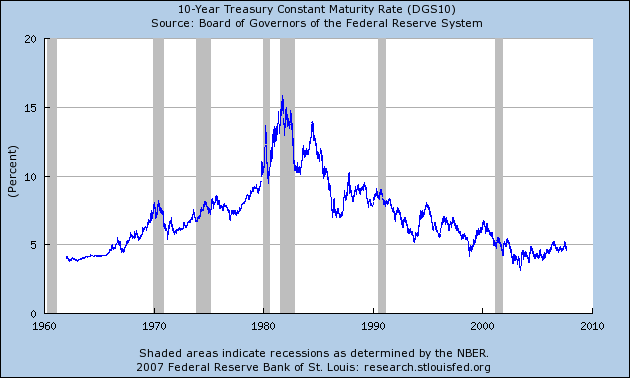
The 10-Year Constantly Maturing Treasury
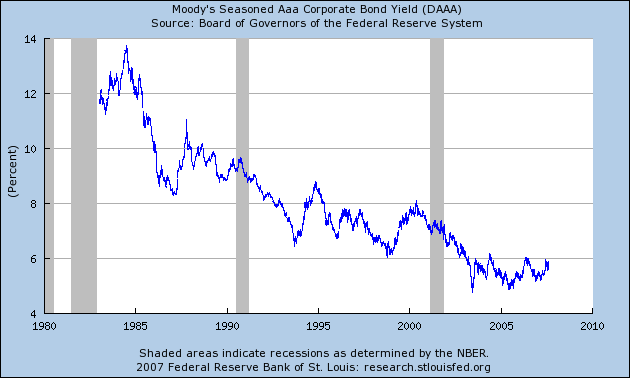
AAA Corporate Paper
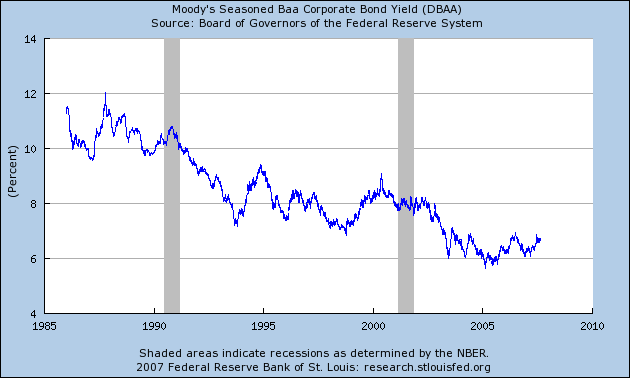
BBB Paper
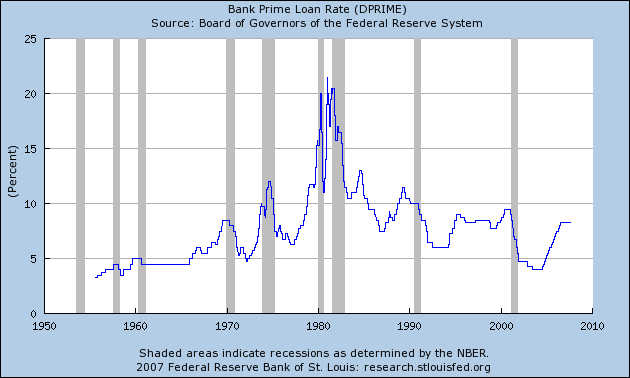
The Prime Rate
The Effective Fed Funds Rate

In addition, the short-term Treasury curve indicates that flooding the system with liquidity won't solve the problem. Just because someone has the money to lend from a liquidity injection does not mean they will use that money to make loans. Here's a chart of the short-term Treasury curve to illustrate that point.
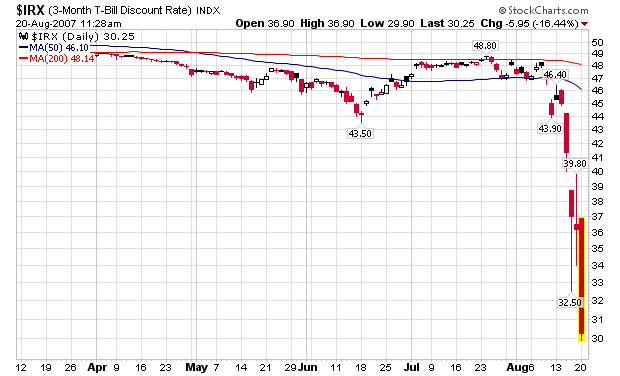
The bottom line is this is a liquidity issue -- people don't want to make loans right now.