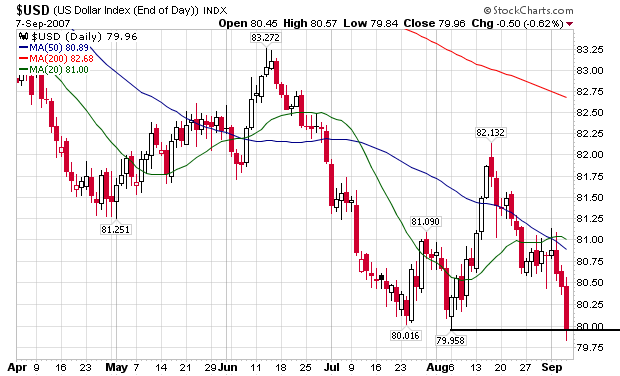
The dollar has been and is in terrible shape. Here is the daily chart. Notice the dollar started selling off in mid-August and is currently testing critical technical levels. The 20 day SMA has an upward trajectory, but recent price action makes the continuation of this trend a near impossibility. In addition, the 50 and 200 day SMAs are moving lower.
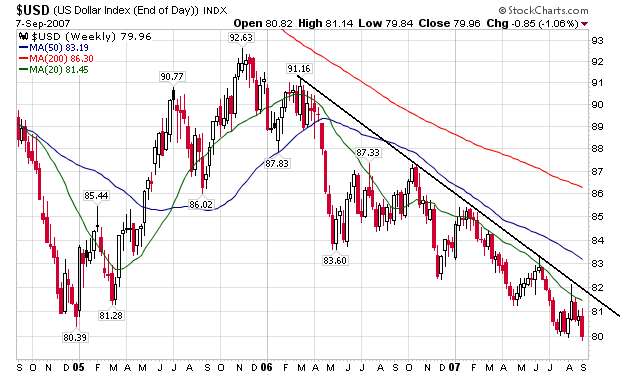
The dollar has been in a downtrend for the last year and a half. All of the simple moving averages are heading lower, and the shorter SMAs are below the longer SMAs. Finally, the dollar is below all three SMAs. These last two observations indicate the most likely downward trajectory is down. This could hem the Federal Reserve's policy options, as a drop in interest rates would most likely negatively impact the dollar.
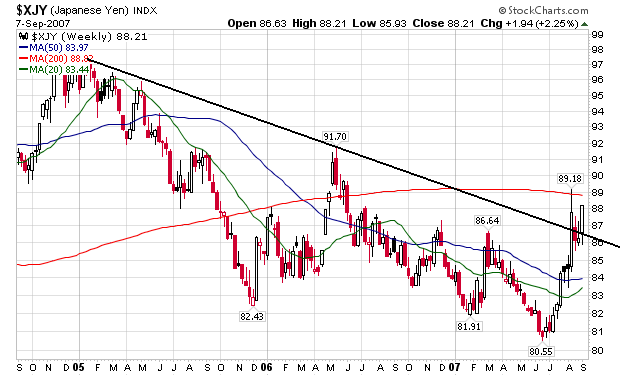
The yen spiked up in mid-August, sold-off on some basic profit taking, then rallied strongly on Friday on the weak employment report. The 20 and 50 day SMAs are all moving higher and the current price action is above these SMAs, indicating a strong possibility of further appreciation.
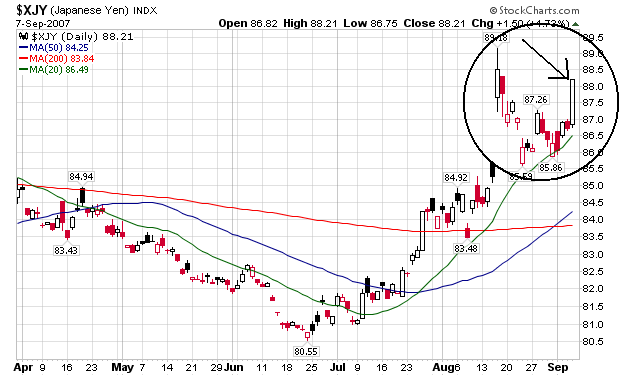
The long-term chart indicates the yen may be breaking a long-term downtrend. The yen rallied above long-term resistance, consolidated above that line, and then started to advance again. Notice the 20 and 50 SMAs are all making a turn into positive territory. Assuming the carry-trade is disappearing, expect this trend to continue.
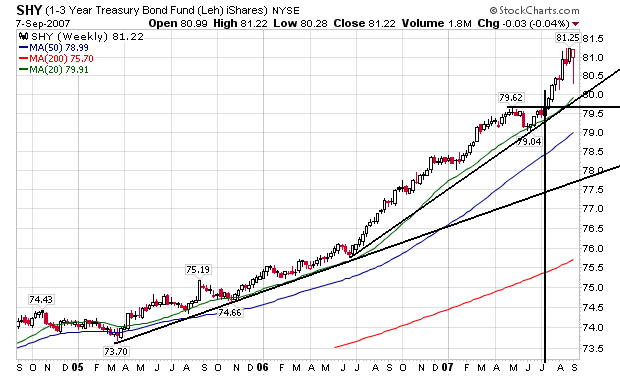
The short end of the Treasury started to rally in mid-June. The rally has continued as investors have sought safety and stability in the short-end of the curve.
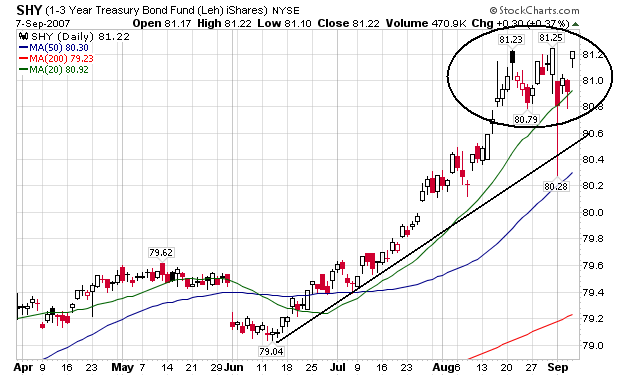
The short-end of the curve has been rallying for the few years, largely because of the Fed's rate increases.