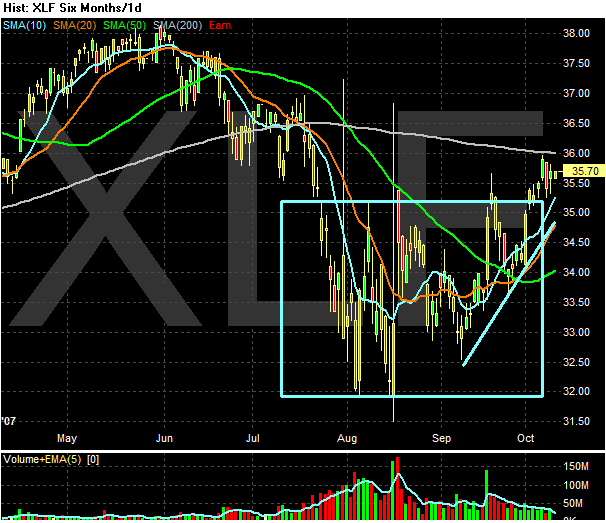
The XLFs have spent about two months trading in a consolidating range that is below the 200 day SMA. Most traders look at the 200 day SMA as the line between bull and bear markets. However, the XLFs didn't fall much below the line. Instead, they merely consolidated. Now we have what looks like the beginning of a rally in place. The price is moving up, the shorter SMAs are above the longer SMAs and we have a trend line in place. Recent news of portfolio write downs hasn't sent this sector lower. My guess is traders think this news is already factored into the price of these shares. Finally, over the last four says the ETF has formed a pennant formation, which could be a consolidation before a move over the 200 day SMA.


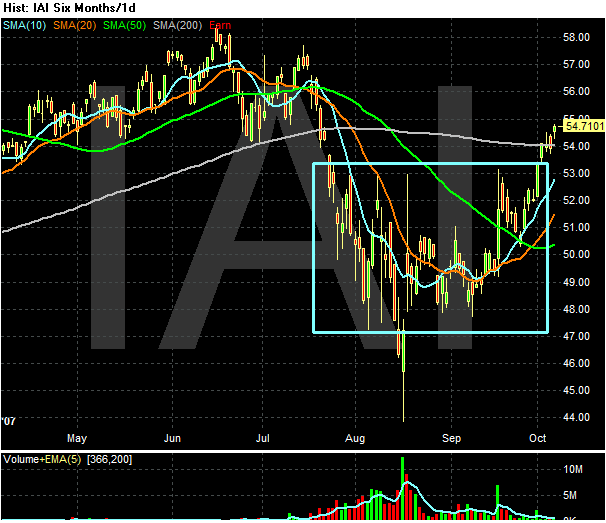
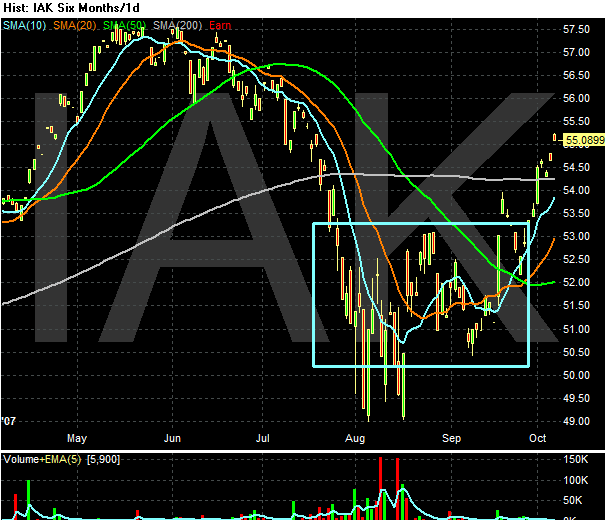
The broker dealer and insurance ETFs have the same characteristics as the XLFs with one key addition. Both of these ETFs have now moved over the 200 day SMA. This is a sign these sectors may at least be moving into a neutral market area rather than bearish.

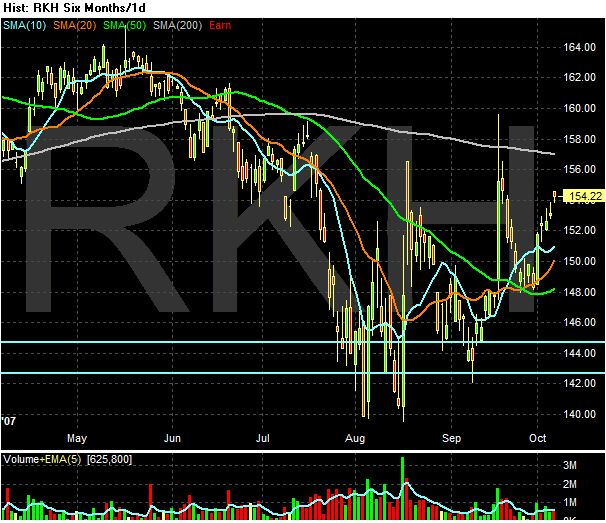
The Regional bank ETF is the most bearish of the ETFs for two reasons.
1.) It is trading the further below the 200 day SMA.
2.) The 10 and 20 day SMA have the weakest upward angle. Frankly, both of these SMAs need better upward movement before this sector can technically recover.