Saturday, June 2, 2007
Friday, June 1, 2007
More On The Jobs Data
Capital Spectator is an economic blog I read regularly. This is a chart from their website that has a 12-month moving average of employment gains.
The graph indicates the employment picture has been spotty for about a year now.
The graph indicates the employment picture has been spotty for about a year now.
Personal Income Down, Spending Up
From the BEA:
However -- here's the really good news:
It's interesting that income dropped when employment showed a strong increase. That leads me to conclude we'll see a revision in one of today's two numbers.
The increase in spending will come as welcome news. Consumer spending has been solid for the last year and has helped to ameliorate the effects of a slowing housing market and drop in business investment.
About the PCE -- while it's only one month with the number inside the Fed's comfort zone, the markets should be very happy. In addition, Bernanke should enjoy this because he has been saying for the last year or so that inflation should come down. Right now he looks pretty damn good.
There are some mixed signals in this report that combined with the employment report raise some questions.
Personal income decreased $7.1 billion, or 0.1 percent, and disposable personal income (DPI) decreased $9.7 billion, or 0.1 percent, in April, according to the Bureau of Economic Analysis. Personal consumption expenditures (PCE) increased $52.0 billion, or 0.5 percent. In March, personal income increased $85.9 billion, or 0.8 percent, DPI increased $71.7 billion, or 0.7 percent, and PCE increased $42.4 billion, or 0.4 percent, based on revised estimates.
.....
Personal outlays -- PCE, personal interest payments, and personal current transfer payments increased $55.2 billion in April, compared with an increase of $44.2 billion in March. PCE increased $52.0 billion, compared with an increase of $42.4 billion.
However -- here's the really good news:
Core consumer price inflation increased just 0.1% in April, bringing the year-over-year increase down to 2%, just inside the Federal Reserve's target, the Commerce Department reported Friday.
It's the first time in 14 months that core prices have been inside the Fed's unofficial target zone of 1% to 2%. Core inflation peaked at 2.4% in February; it was 2.1% in March.
The deceleration in core inflation is welcome news at the Fed, but officials have stressed that they still believe inflation could accelerate again despite the recent improvements.
It's interesting that income dropped when employment showed a strong increase. That leads me to conclude we'll see a revision in one of today's two numbers.
The increase in spending will come as welcome news. Consumer spending has been solid for the last year and has helped to ameliorate the effects of a slowing housing market and drop in business investment.
About the PCE -- while it's only one month with the number inside the Fed's comfort zone, the markets should be very happy. In addition, Bernanke should enjoy this because he has been saying for the last year or so that inflation should come down. Right now he looks pretty damn good.
There are some mixed signals in this report that combined with the employment report raise some questions.
Payrolls Increase 157,000
From the BLS:
Let's look deeper into the numbers:
Goods producing industries lost 19,000, all in manufacturing. There were 0 losses in construction. I have been wondering for a few months if the increase in nonresidential construction is absorbing residential housing jobs. This may be confirmation of that idea.
Education and health care had an increase of 5,000. This area of job creation has been consistently solid for the last few years, so this increase comes as so surprise.
Leisure and hospitality has an increase of 46,000 jobs. Think bartenders and waitresses here.
Professional and service jobs increased 32,000 -- a pretty good increase.
This is a good report which the market should like.
However --
I will also add the BLS has continually revised these numbers as time progresses. As a result these numbers could change pretty drastically.
Nonfarm payroll employment increased by 157,000 in May, and the unemployment rate was unchanged at 4.5 percent, the Bureau of Labor Statistics of the U.S. Department of Labor reported today. Health care and food services added jobs,
while employment declined in manufacturing. Average hourly earnings rose by 6 cents, or 0.3 percent, over the month.
Let's look deeper into the numbers:
Goods producing industries lost 19,000, all in manufacturing. There were 0 losses in construction. I have been wondering for a few months if the increase in nonresidential construction is absorbing residential housing jobs. This may be confirmation of that idea.
Education and health care had an increase of 5,000. This area of job creation has been consistently solid for the last few years, so this increase comes as so surprise.
Leisure and hospitality has an increase of 46,000 jobs. Think bartenders and waitresses here.
Professional and service jobs increased 32,000 -- a pretty good increase.
This is a good report which the market should like.
However --
I will also add the BLS has continually revised these numbers as time progresses. As a result these numbers could change pretty drastically.
Gasoline Prices Drop
From This Week in Petroleum:
Here's a chart of gas prices from the report.
While prices have dropped, notice they are higher than last year by a wide margin.
Production is finally kicking in and gasoline inventories appear to have turned the corner.
This is a very tight situation. While gas production has obviously increased, we don't know if it will be enough to supply the market throughout the busy summer driving season. The situation is very touchy and will require constant monitoring.
After four consecutive weekly increases, the U.S. average retail price for regular gasoline declined 0.9 cent to 320.9 cents per gallon as of May 28, 2007, 34.2 cents per gallon higher than this time last year. However, prices were mixed across the regions. East Coast and Rocky Mountain prices increased, with East Coast prices up 0.1 cent to 309.8 cents per gallon and Rocky Mountain prices up 1.1 cents per gallon to reach 327.6 cents per gallon. In the Midwest, prices declined 0.6 cent to 332.0 cents per gallon, while prices for the Gulf Coast fell 2.5 cents to 306.7 cents per gallon. West Coast prices were down 2.3 cents to 334.9 cents per gallon. The average price for regular grade in California was down 2.9 cents to 340.7 cents per gallon, but remains 14.1 cents per gallon above last year's price.
Here's a chart of gas prices from the report.
While prices have dropped, notice they are higher than last year by a wide margin.
Production is finally kicking in and gasoline inventories appear to have turned the corner.
This is a very tight situation. While gas production has obviously increased, we don't know if it will be enough to supply the market throughout the busy summer driving season. The situation is very touchy and will require constant monitoring.
Thursday, May 31, 2007
Hovnanian Posts Loss and Issues Grim Guidance
From the Street.com
No guidance issued, a big loss for the quarter and a market that "has continued to slip further in many locations in terms of both sales pace and sales prices."
Simply put -- this report indicates housing isn't anywhere near a bottom.
Hovnanian (HOV - Cramer's Take - Stockpickr - Rating) reported a second-quarter loss and painted a bleak picture about the ongoing real estate slowdown, saying the housing market has gotten worse after showing signs of improvement earlier this year.
The Red Bank, N.J., homebuilder withdrew its full-year guidance because of the "increased uncertainty of housing market conditions."
For the quarter ended April 30, Hovnanian recorded a loss of $30.7 million, or 49 cents a share, compared with a year-earlier profit of $101 million, or $1.55 per share. The results were in line with management's previous guidance for a 50-cent loss.
Results were dragged down by $34.4 million of pretax charges related to land impairment and write-offs of predevelopment costs and land deposits. Such writedowns resulted from a continued decline in sales paces and general market conditions in many of the company's communities, Hovnanian said.
Total revenue decreased 29.4% to $1.1 billion in the second quarter. The number of net contracts for new sales, excluding unconsolidated joint ventures, tumbled 21.4% to 3,116 units.
"We are frustrated to report that the housing market has continued to slip further in many locations in terms of both sales pace and sales prices," CEO Ara K. Hovnanian said in a statement. "The housing market weakened in the latter part of the second quarter and the slower conditions have continued into May. Lower prices offered to buyers to close homes during the quarter also led to a further reduction in margins and a net loss for the quarter."
No guidance issued, a big loss for the quarter and a market that "has continued to slip further in many locations in terms of both sales pace and sales prices."
Simply put -- this report indicates housing isn't anywhere near a bottom.
Have We Dodged a Recession?
From MSNBC (and Bonddad's fabulous girlfriend)
That sums up the current problems nicely. Although consumer spending has been strong, business and residential investment has slowed down, leading some to become very concerned about the coming quarters.
Bloomberg has more on this:
Here's a link to the complete report. The overall index is showing an uptrend. It rose in February and March, retreated a bit in April, and rose again this month. The production and employment components have risen for 4 months. New orders spiked up in March, dropped in April and rose again this month. In short, the indicators within the index are looking pretty good right now.
Back to the MSNBC article:
We'll have to see how the employment numbers shake out tomorrow.
Today's construction numbers (detailed below) also indicate business spending is increasing.
In summation, business is looking as though it is spending again. While it's not enough to send the economy into the stratosphere, it may be enough to keep up out of recession.
The biggest wild card in this picture is housing. While I originally thought this sector would cause a recession by now, I think the blog Calculated Risk had the correct answer: housing is going to be a drag on growth for some time. Considering builders don't expect a rebound until 2011 (their words, not mine), I think CR is correct.
This is where my concern about consumer spending really comes into play. We're already one year into the housing downturn. There's only so much bad news people can take before they pull in their wings and slow down their spending. I don't know where that level is (in fact, nobody does). But I think we're closer to it now than we were a year ago.
After a relatively good showing of 2.5 percent growth in the fourth quarter of last year, the U.S. economy slammed on the brakes in the first three months of 2007. Originally pegged at 1.6 percent growth, the government revised that estimate to just 0.6 percent — barely dodging an outright downturn.
An ongoing slump in the housing market, along with layoffs in construction, real estate, mortgage banking and other related industries, has weighed heavily on the economy. Fearing a further slowdown, businesses cut back sharply on inventories in the first quarter to avoid getting caught with unsold goods. That only made the slowdown worse.
That sums up the current problems nicely. Although consumer spending has been strong, business and residential investment has slowed down, leading some to become very concerned about the coming quarters.
But over the past two months there have been signs that business is picking up again. One of the latest came Thursday from a closely watched index of buying by purchasing managers, which moved higher than expected in May and showed strong growth in manufacturing across a broad range of industries. So the sharp cut in inventories in the first quarter may already be helping the economy get back on its feet again.
Bloomberg has more on this:
A measure of U.S. business activity jumped more than forecast in May, signaling expansion for the third consecutive month and suggesting the economy is accelerating after bottoming in the first quarter.
The National Association of Purchasing Management-Chicago said today its business barometer rose to 61.7 in May from 52.9 the prior month. Readings greater than 50 signal expansion,
Export demand and business investment in new equipment are helping to cushion the drag on the economy from the deepest housing recession in a decade and a half. The report lends support to Federal Reserve Chairman Ben S. Bernanke's forecast that the economy may pick up pace later in the year.
``This is a solid report all around and it represents a clear break from the first two months of the year,'' Scott Anderson, senior economist at Wells Fargo Co. in Minneapolis, who had forecast an index reading of 55. ``It suggests that the inventory correction has run its course.''
Here's a link to the complete report. The overall index is showing an uptrend. It rose in February and March, retreated a bit in April, and rose again this month. The production and employment components have risen for 4 months. New orders spiked up in March, dropped in April and rose again this month. In short, the indicators within the index are looking pretty good right now.
Back to the MSNBC article:
>Businesses also seem to be getting back in a hiring mood. After a string of subpar monthly gains in employment, hiring in May appears to have picked up again. The latest jobs numbers from the government are due out Friday; economists are looking for non-farm payroll gains of about 130,000 in May, up from 88,000 in April, according a poll of economists by Reuters.
We'll have to see how the employment numbers shake out tomorrow.
Today's construction numbers (detailed below) also indicate business spending is increasing.
In summation, business is looking as though it is spending again. While it's not enough to send the economy into the stratosphere, it may be enough to keep up out of recession.
The biggest wild card in this picture is housing. While I originally thought this sector would cause a recession by now, I think the blog Calculated Risk had the correct answer: housing is going to be a drag on growth for some time. Considering builders don't expect a rebound until 2011 (their words, not mine), I think CR is correct.
This is where my concern about consumer spending really comes into play. We're already one year into the housing downturn. There's only so much bad news people can take before they pull in their wings and slow down their spending. I don't know where that level is (in fact, nobody does). But I think we're closer to it now than we were a year ago.
Construction Spending Increases
From CBS.Marketwatch:
Here's a link (PDF) to the Census Bureau Report.
A few points.
1.) Nonresidential construction is a little under 52% of total construction spending. So long as nonresidential increases at the same pace residential decreases, overall construction spending will be fine.
2.) Nonresidential construction has increased 12.7% since April 2006, while residential has decreased 14.1%. Because these rates are pretty close to offsetting, I have to wonder if the increase in non-residential construction is absorbing the loss in jobs in the residential construction sector. Overall construction employment has barely dropped in the last year. According to the BLS, it has dropped from 7,699,000 to 7,680,000, or a loss of 19,000. The preceding assumes that nonresidential and residential labor is interchangeable and the nonresidential projects are happening in the same place.
3.) Practically every area of nonresidential spending increased, making the gains pretty broad based.
Spending on U.S. construction projects rose 0.1% in April as a jump in private nonresidential construction outlays offset a drop in spending on residential projects.
Spending on private residential construction projects fell by 1.0% for the second consecutive month, the Commerce Department reported. Meanwhile, private nonresidential construction spending climbed by 1.5% in April, the government said.
Construction spending in March was revised to rise upward, by 0.6%, from a previously estimated gain of 0.2%
Here's a link (PDF) to the Census Bureau Report.
A few points.
1.) Nonresidential construction is a little under 52% of total construction spending. So long as nonresidential increases at the same pace residential decreases, overall construction spending will be fine.
2.) Nonresidential construction has increased 12.7% since April 2006, while residential has decreased 14.1%. Because these rates are pretty close to offsetting, I have to wonder if the increase in non-residential construction is absorbing the loss in jobs in the residential construction sector. Overall construction employment has barely dropped in the last year. According to the BLS, it has dropped from 7,699,000 to 7,680,000, or a loss of 19,000. The preceding assumes that nonresidential and residential labor is interchangeable and the nonresidential projects are happening in the same place.
3.) Practically every area of nonresidential spending increased, making the gains pretty broad based.
Think Housing Has Bottomed?
Go read this post from the Big Picture. Do it now. There's aren't even any words; it's 4 charts that will scare the bejeebus out of you.
On the Wachovia/AG Edwards Deal
From CBS.Marketwatch:
In his book One Up on Wall Street, Fidelity Fund manager Peter Lynch coined a term: "Deworsification." This occurs when a company buys another company that is in a completely different industry. This is the type of transaction to look for as a sign that M&A activity is getting overheated and is probably topping. However, this deal is not an example of this word.
This is a really good example of an intra-industry merger that makes tremendous sense. Wachovia has been using mergers to increase it's market presence in new areas, or to create synergies with existing areas. This is a good example of a company creating synergies. AG Edwards will combine with Wacovia's other assets to make a solid financial services firm. As the article explains:
Yesterday, I wrote a piece about when all of the M&A activity would end. One of the conditions of that analysis was deals that went badly. This one probably won't. In fact, it's a really good example of a good deal (in my opinion).
In other words, this is the type of M&A we should be encouraging.
Pending completion of the deal late this year, the combination will give rise to the No. 2 retail brokerage in the U.S., with $1.1 trillion in client assets and a network of nearly 15,000 financial advisors serving clients nationwide.
The deal moves Wachovia up from the No. 3 spot and behind only Wall Street powerhouse Merrill Lynch & Co. Smith Barney had been the second largest retail brokerage.
The merger would also boost Wachovia's presence in three of the nation's largest states, according to analysts at Lehman Bros., with 25% of A.G. Edwards' assets located in California, Florida and Texas. It will almost double the number of retail offices Wachovia operates and give the bank the opportunity to sell its various banking products directly to A.G. Edwards' customers.
In his book One Up on Wall Street, Fidelity Fund manager Peter Lynch coined a term: "Deworsification." This occurs when a company buys another company that is in a completely different industry. This is the type of transaction to look for as a sign that M&A activity is getting overheated and is probably topping. However, this deal is not an example of this word.
This is a really good example of an intra-industry merger that makes tremendous sense. Wachovia has been using mergers to increase it's market presence in new areas, or to create synergies with existing areas. This is a good example of a company creating synergies. AG Edwards will combine with Wacovia's other assets to make a solid financial services firm. As the article explains:
The merger would also boost Wachovia's presence in three of the nation's largest states, according to analysts at Lehman Bros., with 25% of A.G. Edwards' assets located in California, Florida and Texas. It will almost double the number of retail offices Wachovia operates and give the bank the opportunity to sell its various banking products directly to A.G. Edwards' customers.
....
"The long-term growth opportunities of the brokerage industry are extremely compelling to Wachovia, and we have long expressed our interest in growing this business both organically and through acquisition," said Ken Thompson, Wachovia's chairman and chief executive, in a statement.
Yesterday, I wrote a piece about when all of the M&A activity would end. One of the conditions of that analysis was deals that went badly. This one probably won't. In fact, it's a really good example of a good deal (in my opinion).
In other words, this is the type of M&A we should be encouraging.
BEA Adjusts GDP Down to .6%
From Bloomberg
From the BEA:
Looking at the numbers we have the following.
Personal Consumption Expenditures increased at 4.4% seasonally adjusted annual rate. This is solid growth, and has been the backbone of the current economy.
Gross Private Domestic Investment decreased at a seasonally adjusted annual rate (SAAR) of 9.3%. Residential investment was the primary culprit, declining at a 15.4% SAAR.
Non-residential investment increased at a 2.9% SAAR. This is the weakest growth rate since the 4th quarter of 2003 and 1st quarter of '04.
Net exports decreased at a .6% seasonally adjusted annual rate while imports increased at a 5.7% SAAR.
Government spending increased at a 1% SAAR.
Let's see what the possibility of these trends continuing is.
PCEs had a bad April, with 79% of retailers reported disappointing earnings. However, the latest International Council of Shopping Centers weekly report showed a gain. So, consumers may have simply had a bad month. Tomorrow's income report will be very important.
There is sign business investment may be increasing. Last month's industrial production report showed a solid, across-the-board increase. We'll need a few more months of data before that trend is firmly in place.
Government expenditures come in waves, so expect to see this number rebound in the next few quarters.
Imports will be a drag on growth so long as the US is an oil importer. Exports will be less than imports for the foreseeable future.
So, going forward we need to pay special attention to two areas: consumer spending and business investment.
The U.S. economy grew last quarter at a 0.6 percent annual rate, the weakest in more than four years, as housing slumped, the trade deficit widened and businesses reduced inventories.
The gain in gross domestic product was weaker than the median forecast by economists and compares with a 1.3 percent pace initially estimated last month, according to revised figures from the Commerce Department today in Washington.
Last quarter may prove to be the low point for the economy as recent reports showed business spending improved and leaner stockpiles prompted factories to boost production, economists said. Such an outcome would bear out forecasts by Federal Reserve policy makers, who this month reiterated that growth will pickup for the rest of this year and into next.
``We're looking for a gradual firming in growth,'' Michael Feroli, an economist at JPMorgan Chase & Co. in New York, said before the report. ``The inventory situation is a lot more favorable, and the drag from housing will be reduced.''
From the BEA:
Real gross domestic product -- the output of goods and services produced by labor and property located in the United States -- increased at an annual rate of 0.6 percent in the first quarter of 2007, according to preliminary estimates released by the Bureau of Economic Analysis. In the fourth quarter, real GDP increased 2.5 percent.
The GDP estimates released today are based on more complete source data than were available for the advance estimates issued last month. In the advance estimates, the increase in real GDP was 1.3 percent (see "Revisions" on page 3).
The increase in real GDP in the first quarter primarily reflected positive contributions from personal consumption expenditures (PCE) and state and local government spending that were partly offset by negative contributions from private inventory investment, residential fixed investment, and federal government spending. Imports, which are a subtraction in the calculation of GDP, increased.
The deceleration in real GDP growth in the first quarter primarily reflected an upturn in imports, downturns in exports and in federal government spending, and a deceleration in PCE for nondurable goods that were partly offset by an upturn in equipment and software, a smaller decrease in residential fixed investment, accelerations in PCE for durable goods and in PCE for services, and a smaller
decrease in private inventory investment.
Looking at the numbers we have the following.
Personal Consumption Expenditures increased at 4.4% seasonally adjusted annual rate. This is solid growth, and has been the backbone of the current economy.
Gross Private Domestic Investment decreased at a seasonally adjusted annual rate (SAAR) of 9.3%. Residential investment was the primary culprit, declining at a 15.4% SAAR.
Non-residential investment increased at a 2.9% SAAR. This is the weakest growth rate since the 4th quarter of 2003 and 1st quarter of '04.
Net exports decreased at a .6% seasonally adjusted annual rate while imports increased at a 5.7% SAAR.
Government spending increased at a 1% SAAR.
Let's see what the possibility of these trends continuing is.
PCEs had a bad April, with 79% of retailers reported disappointing earnings. However, the latest International Council of Shopping Centers weekly report showed a gain. So, consumers may have simply had a bad month. Tomorrow's income report will be very important.
There is sign business investment may be increasing. Last month's industrial production report showed a solid, across-the-board increase. We'll need a few more months of data before that trend is firmly in place.
Government expenditures come in waves, so expect to see this number rebound in the next few quarters.
Imports will be a drag on growth so long as the US is an oil importer. Exports will be less than imports for the foreseeable future.
So, going forward we need to pay special attention to two areas: consumer spending and business investment.
WSJ Gets The Fed Right
From the WSJ:
There's been a lot of talk about the possibility of a rate cut. However, the Fed's own statements have been incredibly consistent. They have consistently stated inflation is their primary concern. Every public statement dealing with the economy has had a paragraph about inflation which has universally had the sentiment, "inflation remains elevated and that makes us really unhappy."
I get a bit perturbed at the entire class of Fed prognosticators who read waaaaayyyyyy too much into the Fed statement. I think some of these people need to go back and take a remedial reading course.
On May 9, the Fed left its short-term interest-rate target at 5.25%, where it has stood since last June. It released a statement reiterating that inflation remained its predominant concern and that policy makers considered inflation "elevated." That surprised some observers, given prior data showing inflation had slowed a bit.
The more confident outlook about economic activity would appear to diminish the odds that the Fed will cut interest rates in coming months. "Policy is on hold for as far as the eye can reasonably see," Joshua Shapiro, chief U.S. economist at consulting firm MFR Inc., said in a note to clients.
The Fed's continued focus on inflation, despite risks economic growth will slow, "suggests that the market should not expect a dramatic shift in Fed thinking without a dramatic shift in the economic data," Lehman Brothers economist Drew Matus said in a note to clients.
There's been a lot of talk about the possibility of a rate cut. However, the Fed's own statements have been incredibly consistent. They have consistently stated inflation is their primary concern. Every public statement dealing with the economy has had a paragraph about inflation which has universally had the sentiment, "inflation remains elevated and that makes us really unhappy."
I get a bit perturbed at the entire class of Fed prognosticators who read waaaaayyyyyy too much into the Fed statement. I think some of these people need to go back and take a remedial reading course.
Wednesday, May 30, 2007
An Interesting Rally
I was looking at the sector breakdown of today's rally on Marketgauge. There is something interesting lurking behind the market's performance. Today's volume of all industries except utilities was below average.
Yet, today's volume for the SPY's, QQQQs, IWNs and DIAs was higher than previous days.
Interesting.
Yet, today's volume for the SPY's, QQQQs, IWNs and DIAs was higher than previous days.
Interesting.
FOMC Minutes
Here is a link to the Fed Minutes from May 9, 2007. Let's see how the Fed saw the economy a little under a month ago:
We pretty much already knew that.
This isn't that good, either. Weak job growth is always bad.
The Fed noted the last month was strong across the board, but that was only 1 month.
This has been the real story of this slowdown -- the strength in consumer spending. It has remained strong for the last 4 quarters when other areas of the economy were slowing.
I've covered this to death.
One sub-area of business investment declined and one increased, making total growth "moderate".
In other words, business is stocking up on less stuff.
This is what may keep the US out of a recession. With a cheap dollar and the rest of the world's growth picking up, the US may be able to export enough to keep growth barely positive for the next quarter or so.
OK -- I'll say this one more time. The Fed is not comfortable with inflation's current level. They've said it repeatedly for the last 6 months or so.
So -- where does this leave us?
1.) The economy is slowing, but we're not in a recession. While housing is slowing down, business investment is moderate and the consumer continues to spend at high rates. Job growth is weak. This makes Friday's number really important. Also remember, the 1st GDP revision comes out tomorrow.
2.) Inflation is too high for the Fed.
3.) Rates aren't coming own anytime soon.
The information reviewed at the May meeting suggested that economic activity had expanded at a below-trend pace in recent months.
We pretty much already knew that.
The average monthly increase in payroll employment through the first four months of this year was well below the relatively strong pace recorded in the fourth quarter of 2006. In April, the construction industry continued to shed jobs, manufacturing employment declined further, and retailers reduced hiring after a large gain in March. The unemployment rate stood at 4.5 percent in April, similar to its average in the first quarter, and the labor force participation rate moved down.
This isn't that good, either. Weak job growth is always bad.
Industrial production increased at a modest annual rate of 1.4 percent in the first quarter, with the monthly pattern reflecting fluctuations in the output of utilities, which was influenced importantly by swings in weather conditions.
The Fed noted the last month was strong across the board, but that was only 1 month.
Real consumer expenditures increased at a brisk pace in the first quarter, although monthly gains in spending slowed over the course of the quarter, in part because of swings in weather-related outlays on energy goods and energy services.
This has been the real story of this slowdown -- the strength in consumer spending. It has remained strong for the last 4 quarters when other areas of the economy were slowing.
Residential construction activity remained soft as builders attempted to work off elevated inventories of unsold new homes.
I've covered this to death.
Real spending on equipment and software rose modestly in the first quarter after having fallen in the fourth quarter of 2006. Spending on high-tech equipment, boosted by a surge in outlays on computers, posted a substantial increase in the first quarter. In addition, purchases of communications equipment--which tend to be volatile quarter to quarter--rebounded strongly after a fourth-quarter dip. By contrast, spending on transportation equipment declined significantly:
One sub-area of business investment declined and one increased, making total growth "moderate".
Real nonfarm inventory investment excluding motor vehicles increased at a slower pace in the first quarter of 2007 than in the previous quarter. The downshift in inventory investment had helped to reduce the apparent overhangs that had emerged in late 2006.
In other words, business is stocking up on less stuff.
Economic activity in advanced foreign economies appeared to have grown at a steady rate in the first part of the year.
This is what may keep the US out of a recession. With a cheap dollar and the rest of the world's growth picking up, the US may be able to export enough to keep growth barely positive for the next quarter or so.
The total PCE price index rose substantially in both February and March. The advance in February was distributed across a broad range of categories, while the March increase was driven largely by a jump in the index for energy. Core PCE prices were unchanged in March after an upswing in February. Smoothing through the high-frequency movements, the twelve-month change in the core PCE price index in March was just a touch higher than the increase over the year-earlier period
OK -- I'll say this one more time. The Fed is not comfortable with inflation's current level. They've said it repeatedly for the last 6 months or so.
So -- where does this leave us?
1.) The economy is slowing, but we're not in a recession. While housing is slowing down, business investment is moderate and the consumer continues to spend at high rates. Job growth is weak. This makes Friday's number really important. Also remember, the 1st GDP revision comes out tomorrow.
2.) Inflation is too high for the Fed.
3.) Rates aren't coming own anytime soon.
Bonddad On the Huffington Post
The Huffington Post has started a business section and they have asked me to contribute. Here is a link to my first post.
I'll be writing longer, hopefully less "eco-geeky" posts there.
I'll be writing longer, hopefully less "eco-geeky" posts there.
Pulte Homes Cuts 16% of Workforce
From CNBC:
Notice the public statement from the President and CEO: "The homebuilding environment remains difficult". This is at the same time new home sales spiked 16% last month.
I don't see how the new home sales figures aren't getting revised down with news like this.
Facing a grim housing market, Pulte Homes said Tuesday that it is cutting about 16% of its work force, or about 1,900 jobs, as part of a restructuring.
Pulte Homes Inc. one of the nation's leading homebuilders, said the restructuring will save an estimated $200 million a year before taxes.
"The homebuilding environment remains difficult, and our current overhead levels are structured for a business that is larger than the market presently allows," Richard J. Dugas Jr., president and chief executive, said in a news release.
Notice the public statement from the President and CEO: "The homebuilding environment remains difficult". This is at the same time new home sales spiked 16% last month.
I don't see how the new home sales figures aren't getting revised down with news like this.
When Will The M&A End?
From the Financial Times:
So -- when will this end? Cramer of Mad Money Fame offers five signs the boom will end.
Let's take these one at a time.
1.) Credit is still cheap. While I wrote below about increasing interest rates, the 10-year Treasury is still below 5%. That's really cheap credit by historical standards. In addition, corporate credit is also very cheap, especially by historical standards. Until rates move higher, companies can access the credit markets for funds.
2.) I can't speak to the IPO market's liquidity, but there has been a complete black-out of news stating IPOs are getting canceled in a big way.
3.) It takes awhile for mergers to complete -- at least a year and that's assuming everything goes right (which it won't). Easing the assimilation process is the large number of intra-industry mergers. So long as mergers are within the same or complimentary industries it's doubtful we're going to see deals go bad in a big way. And when they do go bad, there's is a more than minimal chance the reason will be company/merger participant specific (say a CEO who just isn't people/culture savvy) as opposed to a bad overall idea.
4.) According to Barron's, the DOW has a PE of 17.89, and the S&P is at 18.18. According too Margetguage, technology is the most expensive are with a PE of 30. We have several industries with a PE in the 20s and 5 with PEs in the teens. In short, the market isn't cheap, but it's not expensive right now either.
5.) There is a ton of liquidity right now. As if the Japan/US carry trade wasn't enough, we have a very clean corporate balance sheets allowing increased debt issuance, $2.5 trillion in foreign government investment funds available and an increasing money supply.
So, there is a great deal of evidence to back-up Cramer's analysis.
Buy-out groups in the US are having their busiest month on record after launching nearly $82bn-worth of bids since the beginning of May.
The frenzy of activity defies predictions of a slowdown in the private equity-driven deal boom but could also signal a desire by buy-out funds to rush into deals before credit markets take a turn for the worse.
So -- when will this end? Cramer of Mad Money Fame offers five signs the boom will end.
1. Interest rates on the long end going to at least 6%-7%. At that point, I believe it will get too risky.
2. The equity market being closed to the IPOs of the companies that need to be flipped. It's wide open right now.
3. Not one, not two, but maybe three or four, or even five deals going bust. Can't we wait for even one to go belly-up before we get too nervous?
4. Valuations ramping up more. With the S&P 500 selling for about 17.5 times next year's earnings, there is plenty of room to keep buying.
5. Private equity funds running out of money. Very unlikely.
Let's take these one at a time.
1.) Credit is still cheap. While I wrote below about increasing interest rates, the 10-year Treasury is still below 5%. That's really cheap credit by historical standards. In addition, corporate credit is also very cheap, especially by historical standards. Until rates move higher, companies can access the credit markets for funds.
2.) I can't speak to the IPO market's liquidity, but there has been a complete black-out of news stating IPOs are getting canceled in a big way.
3.) It takes awhile for mergers to complete -- at least a year and that's assuming everything goes right (which it won't). Easing the assimilation process is the large number of intra-industry mergers. So long as mergers are within the same or complimentary industries it's doubtful we're going to see deals go bad in a big way. And when they do go bad, there's is a more than minimal chance the reason will be company/merger participant specific (say a CEO who just isn't people/culture savvy) as opposed to a bad overall idea.
4.) According to Barron's, the DOW has a PE of 17.89, and the S&P is at 18.18. According too Margetguage, technology is the most expensive are with a PE of 30. We have several industries with a PE in the 20s and 5 with PEs in the teens. In short, the market isn't cheap, but it's not expensive right now either.
5.) There is a ton of liquidity right now. As if the Japan/US carry trade wasn't enough, we have a very clean corporate balance sheets allowing increased debt issuance, $2.5 trillion in foreign government investment funds available and an increasing money supply.
So, there is a great deal of evidence to back-up Cramer's analysis.
10-Year Rates Increasing
The 10-year Treasury Bond has been selling off for the last few weeks, sending yields to the 4.9% level. Here's a daily chart from stockcharts.com
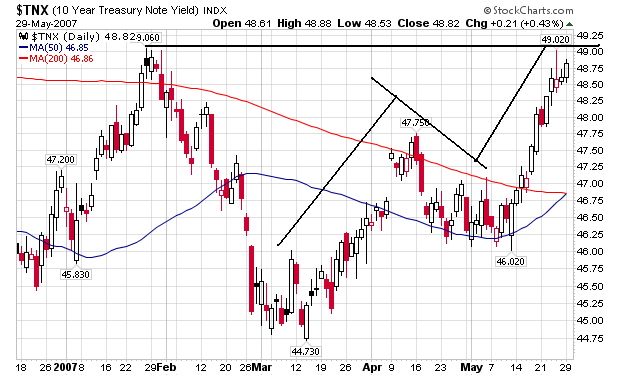
Notice the following.
1.) Prices sold-off starting in early March (remember, price and yield move inversely). They stabilized from late April to early May when they resumed their sell-off. The trading pattern is a standard rally, consolidation, rally pattern and indicates a fairly orderly path to the current price level.
2.) The 10-year yield is approaching a 6-month high.
Here's the weekly chart.
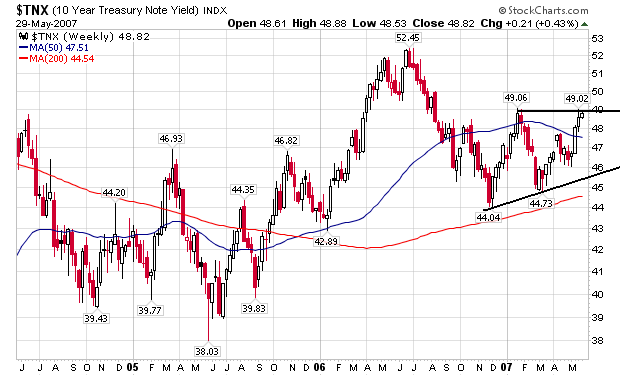
Prices have been in a trading range since late 2006. If they break from this range we could approach the multi-year highs in yield.
Notice the following.
1.) Prices sold-off starting in early March (remember, price and yield move inversely). They stabilized from late April to early May when they resumed their sell-off. The trading pattern is a standard rally, consolidation, rally pattern and indicates a fairly orderly path to the current price level.
2.) The 10-year yield is approaching a 6-month high.
Here's the weekly chart.
Prices have been in a trading range since late 2006. If they break from this range we could approach the multi-year highs in yield.
Inflation Expectations Increasing
From the WSJ:
Standard economy theory states that when people have higher inflation expectations they will spend more now while their dollars are more valuable. If this assumption is true, we could have a partial explanation for why consumer spending has been resilient for about the last year.
I should add, I'm not a bit fan of the psychological side of economic theory, but that's just me arguing economics is trying to explain something way beyond its boundaries.
Higher fuel costs, however, have caused consumers to expect a pickup in inflation in the next 12 months -- to 5.5%, compared with the 4.6% they expected in February.
Standard economy theory states that when people have higher inflation expectations they will spend more now while their dollars are more valuable. If this assumption is true, we could have a partial explanation for why consumer spending has been resilient for about the last year.
I should add, I'm not a bit fan of the psychological side of economic theory, but that's just me arguing economics is trying to explain something way beyond its boundaries.
Tuesday, May 29, 2007
Housing Bad News Continues
From Bloomberg:
For anyone who is calling a bottom to the housing market, this news essentially blows you out of the water. There is no good news coming from this part of the economy right now. Considering the massive overhang in inventory, I don't expect this trend to stop in the near future.
Compounding the problem is the sentiment of industry insiders who don't see a rebound in homebuilding until 2011:
The article points out a very important point: we're still working our way through the ARMs resets, and will be for the remainder of this year. I would guess the fallout from that part of the market will continue for at least another 6 months, and probably longer.
Home prices in the U.S. dropped last quarter for the first time in almost 16 years, as 13 out of 20 cities reported declines in March.
The value of a house dropped 1.4 percent in the first three months of the year from the same period in 2006, according to a report today by S&P/Case-Shiller. Prices last fell during the third quarter of 1991.
The retreat may deter owners from tapping into home equity for extra cash, economists said. Combined with record gasoline prices, lower home prices raise concern consumer spending, which accounts for more than two-thirds of the economy, will slow.
``We don't see a big rebound in economic growth,'' said Scott Anderson, a senior economist at Wells Fargo & Co. in Minneapolis.
For anyone who is calling a bottom to the housing market, this news essentially blows you out of the water. There is no good news coming from this part of the economy right now. Considering the massive overhang in inventory, I don't expect this trend to stop in the near future.
Compounding the problem is the sentiment of industry insiders who don't see a rebound in homebuilding until 2011:
New home construction in the U.S. may take until 2011 to return to last year's level, said David Seiders, chief economist for the National Association of Home Builders in Washington.
Monthly construction starts would need to jump by 21 percent to reach Seiders's benchmark for full recovery, which is 1.85 million. There were 1.53 million in April, the Commerce Department said. At the height of the five-year housing boom in January 2006, construction began on 2.29 million homes.
``We've fallen way below trend because we soared way above trend during boom times,'' Seiders said in an interview. ``The upswing will be relatively slow, unlike earlier cycles.''
The inventory of unsold homes is the largest since the Chicago-based National Association of Realtors started counting them in 1999 and house prices have suffered the steepest drop since the Great Depression, according to the realtors' group. Defaults and foreclosures also may rise as about $650 billion of loans to subprime borrowers, those with poor or limited credit histories, reset at higher interest rates by 2009.
The article points out a very important point: we're still working our way through the ARMs resets, and will be for the remainder of this year. I would guess the fallout from that part of the market will continue for at least another 6 months, and probably longer.
Is This Really A Goldilocks Economy?
From IBD:
Business investment has been slow for the last two quarters, coming in at a seasonally adjusted annual rate of -3.1% and 2%. While durable goods orders have increased, they are still at low levels. Here is a durable goods chart from Martin Capital. Notice where orders are in the cycle. It is just as possible for orders to drop from here as go up.
Later in the article, the author makes the following observations:
So far, consumer spending has been very strong. However, decreasing wages and increasing gas prices are a recipe for a slowdown in consumer spending. While we haven't seen a slowdown in consumer spending establish a trend, we saw a really bad April. And there is also the housing slump to contend with.
I am not a fan of the "Goldilocks" description. I think a better description is the "hanging on" economy. There are just enough positive developments to keep us out of recession. The key right now is consumer spending, which represents 70% of GDP growth. As previously mentioned, consumer spending has been solid so far. But with gas prices spiking before summer it's possible the consumer will come under increasing pressure for the next three months. This may be just long enough for the consumer to reign in spending enough to really impact GDP.
"This points to improving prospects for the economy in the second half," said Lakshman Achuthan, ECRI's managing director. He called the possibility of a recession this year "minuscule."
The index's rise stems from some healing in sickly manufacturing.
"Services were always holding up. But the industrial side is (improving) where it used to be a drag on the economy," he said.
Durable goods orders rose 0.6% in April, the third straight monthly gain. Core capital goods orders, a proxy for business investment, are turning higher again as well.
The ISM manufacturing index and industrial production also signal a factory rebound.
Achuthan characterized the current economy as "Goldilocks with blemishes," or one marked by moderate growth and expectations for moderate inflation.
Business investment has been slow for the last two quarters, coming in at a seasonally adjusted annual rate of -3.1% and 2%. While durable goods orders have increased, they are still at low levels. Here is a durable goods chart from Martin Capital. Notice where orders are in the cycle. It is just as possible for orders to drop from here as go up.
Later in the article, the author makes the following observations:
Gasoline prices are already at record highs as the summer driving season kicks off.
But wages, a bigger factor for inflation, have risen less than expected for much of the year. Sustained productivity growth has kept anticipated inflationary increases mostly at bay, though efficiency gains are slowing
So far, consumer spending has been very strong. However, decreasing wages and increasing gas prices are a recipe for a slowdown in consumer spending. While we haven't seen a slowdown in consumer spending establish a trend, we saw a really bad April. And there is also the housing slump to contend with.
I am not a fan of the "Goldilocks" description. I think a better description is the "hanging on" economy. There are just enough positive developments to keep us out of recession. The key right now is consumer spending, which represents 70% of GDP growth. As previously mentioned, consumer spending has been solid so far. But with gas prices spiking before summer it's possible the consumer will come under increasing pressure for the next three months. This may be just long enough for the consumer to reign in spending enough to really impact GDP.
NYSE Short Sales Nearing Record
From Bloomberg:
When there are a lot of shorts in a market it actually adds upward price pressure. As markets rise, shorts are forced to cover their positions, which sends shares higher.
I should add that 1931 was a really bad year for the market. I have an old chart of the Axe-Houghton Industrial Stock Price Average from the book Profits in the Stock Market by Gartley. The index dropped from about 180 to 100. However, the US was right at the beginning of the depression then.
Short sellers are betting against U.S. stocks like never before as the Standard & Poor's 500 Index approaches an all-time high. That's making some of the biggest bulls even more optimistic.
``What the short seller appears to be doing is doubling down,'' said Kenneth Fisher, who oversees about $40 billion as chairman of Fisher Investments in Woodside, California. ``You love to see it, because if you believe there is a basic driver to the bull market, they're going to get run over.''
The amount of shorting -- where traders sell borrowed stocks expecting to buy them back after prices fall -- jumped to 3.1 percent of the total shares listed on the New York Stock Exchange this month. That's the highest since at least 1931, according to Bespoke Investment Group LLC, a research firm in Mamaroneck, New York.
When there are a lot of shorts in a market it actually adds upward price pressure. As markets rise, shorts are forced to cover their positions, which sends shares higher.
I should add that 1931 was a really bad year for the market. I have an old chart of the Axe-Houghton Industrial Stock Price Average from the book Profits in the Stock Market by Gartley. The index dropped from about 180 to 100. However, the US was right at the beginning of the depression then.
Monday, May 28, 2007
Housing: Oversupply Isn't the Word
This is from the blog Interest Rate Roundup.
* Census data on new home inventory goes back to 1963. Prior to the latest down cycle, the highest inventory level recorded was 432,000 units in August 1973. Throughout the 1980s and 1990s, it was customary to have about 300,000 to 320,000 homes for sale, with peaks (in 1989 and 1995) of around 370,000.
This time around, supply has come down somewhat from the July 2006 peak of 573,000 units. But it's clear that we still have a major inventory glut -- something on the order of 150,000-200,000 units.
* So what about the existing home market? That 4.2 million inventory reading is quite literally off the charts. My data for combined SFH+co-op+condo inventory only goes back to early 1999. Between that year and 2004, inventory typically ran in the 2 million - 2.5 million unit range. In other words, we are potentially oversupplied to the tune of 1.7 million to 2.2 million units.
If you just look at the single-family only data (3.59 million units in April 2007), it's the same story -- a historical inventory glut. This measure typically ranged from around 1.5 million units to 2.3 million units throughout the 1990s and early 2000s.
Corporate Balance Sheets, Merger Mania and the Current Rally
Although the US economy is operating at less than peak performance, the stock market is rallying. M&A is a primary reason for this rally. It seems that every Monday new deals are announced. How long will the pace of these deals continue?
They also had a very nice graph accompanying the highlights:
The graph highlights a few interesting points:
1.) Corporations are issuing more debt than equity.
2.) The total value of M&A activity (as a percentage of GDP) is approaching the pace of the late 1990s, but isn't there yet.
According to the Federal Reserve's Flow of Funds report (PDF) corporations have cleaned up their balance sheets over the last few years. Total liabilities of non-farm non-financial corporate business increased (in billions) from $9,922 at the end of 2002 to $10,493 at the end of the 4th quarter in 2006, or an increase of 5.75%. Over the same period, total assets increased (in billions) from $19,473 to $24,621, or an increase of 26.43%. As a result, total net worth of US business increased (in billions) from $9,551 at the end of 2002 to $14,128 (see page 103 of the FOF).
It's not that corporations have been issuing tons of debt. Non-financial corporate business issued $132.3 billion debt in 2002 and $322.3 billion in the last quarter of 2006 (see page 44 FOF). However, corporations have been buying back tons of stock. Non-financial corporate business issued -41.6 billion of equities in 2002 and -701.2 billion in the 4th quarter of 2006 (page 45 FOF).
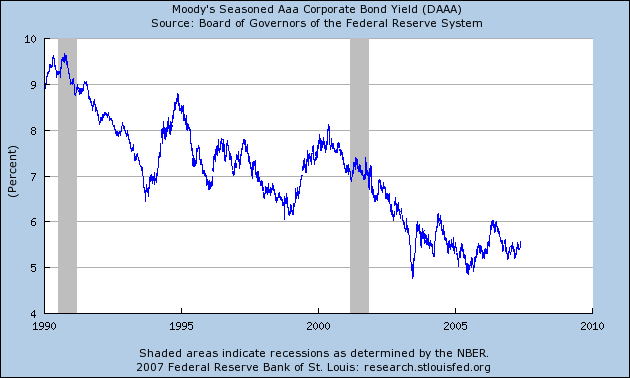
What's a bit odd about this is corporate bond yields have been conducive to borrowing. Here is the yield of the AAA and BBB corporate market from the St. Louis Federal Reserve:
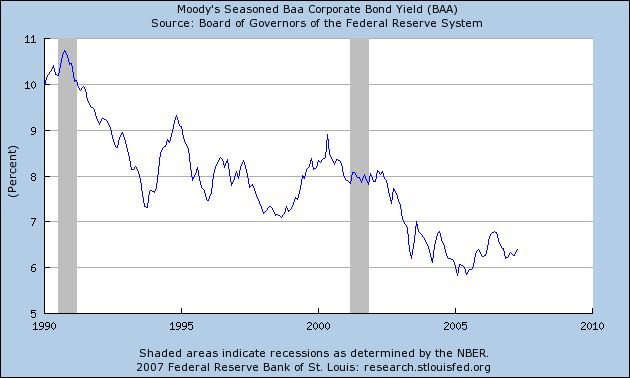
So, let's sum up this picture.
1.) Non-financial, non-farm business is in great financial shape. Debt issuance is low and stock buy-backs are high.
2.) As a result, corporations are in a great place to perform tons of M&A activity. Interest rates are still very low, which encourages this activity.
Let's carry this one step further. A weak economy actually plays into the M&A rally because a weak economy increases speculation the Fed will lower rates, which will add more fuel to the M&A fire.
Our U.S. Investment Strategy service noted last week in a Special Report that corporate bond spreads have stayed tight, and the level of bond yields remains low, acting to turbo-charge the stampede to buy/retire equities. The wide gap between equity and corporate bond valuations is being arbitraged and will persist until the valuation gap is closed. If a mania develops like in the late 1990s, then the gap could even move into negative territory. Although such a shift seems a long way off, M&A activity is expediting the re-leveraging, and the financial and investment communities are rushing to take part in this stampede.
They also had a very nice graph accompanying the highlights:
The graph highlights a few interesting points:
1.) Corporations are issuing more debt than equity.
2.) The total value of M&A activity (as a percentage of GDP) is approaching the pace of the late 1990s, but isn't there yet.
According to the Federal Reserve's Flow of Funds report (PDF) corporations have cleaned up their balance sheets over the last few years. Total liabilities of non-farm non-financial corporate business increased (in billions) from $9,922 at the end of 2002 to $10,493 at the end of the 4th quarter in 2006, or an increase of 5.75%. Over the same period, total assets increased (in billions) from $19,473 to $24,621, or an increase of 26.43%. As a result, total net worth of US business increased (in billions) from $9,551 at the end of 2002 to $14,128 (see page 103 of the FOF).
It's not that corporations have been issuing tons of debt. Non-financial corporate business issued $132.3 billion debt in 2002 and $322.3 billion in the last quarter of 2006 (see page 44 FOF). However, corporations have been buying back tons of stock. Non-financial corporate business issued -41.6 billion of equities in 2002 and -701.2 billion in the 4th quarter of 2006 (page 45 FOF).
What's a bit odd about this is corporate bond yields have been conducive to borrowing. Here is the yield of the AAA and BBB corporate market from the St. Louis Federal Reserve:
So, let's sum up this picture.
1.) Non-financial, non-farm business is in great financial shape. Debt issuance is low and stock buy-backs are high.
2.) As a result, corporations are in a great place to perform tons of M&A activity. Interest rates are still very low, which encourages this activity.
Let's carry this one step further. A weak economy actually plays into the M&A rally because a weak economy increases speculation the Fed will lower rates, which will add more fuel to the M&A fire.
Sunday, May 27, 2007
Notes of the SPY
I keep a notebook of trading ideas and economic/market observations. Here is what I wrote about the SPYs a few days ago. There is no order of importance to any of the ideas. It's simply a running list/stream-of-consciousness group of observations.
For those of you who watch the markets, I would strongly suggest doing the same. It really helps to keep your mind focused. Also -- and I have no idea why this is -- writing things down helps me remember things. I got this idea (keeping a notebook) after reading The Money Masters series. This is a book of interviews with various money managers. At the end of the book the author makes some observations about what all the traders have in common. The first thing he mentions is they all keep a notebook.
- broke through a month and a half trend line. However, it is still above the 20-day SMA. It is possible the trend line shifted down, but the previous trend line had more support from various price points. OBV has been in a range for all of May at around (roughly) 4.5 billion. CMF (Chaiken Money Flow)went negative, But this indicator has barely gone negative in the last 9 months. P&F (2 points/box and 2 box reversal) chart is still bullish double top breakout. There is so selling pressure on the P&F chart. However, the trend break on the candle chart may be a precursor to the P&F break.
The SPYs increased from (roughly) 137 to 153 afte the China sell-off -- an 11.67% increase. In May the 5 day moving average of volume increased a bit and there have been four big down volume days, although prices have only dropped big on 2 of those days.
The NY advance/decline line was stagnant for most of May, although the new high/new low line continues up.
For those of you who watch the markets, I would strongly suggest doing the same. It really helps to keep your mind focused. Also -- and I have no idea why this is -- writing things down helps me remember things. I got this idea (keeping a notebook) after reading The Money Masters series. This is a book of interviews with various money managers. At the end of the book the author makes some observations about what all the traders have in common. The first thing he mentions is they all keep a notebook.
April Same Store Sales Final Tally: 79% Miss Expectations
From seeking Alpha:
The article provides a list of the major retailers. It's not pretty.
We have to watch retail sales very closely over the next few months to see about the consumer's overall health.
Most retailers announced April same-store sales Thursday. According to Thomson Financial, 79% of them missed expectations. We'll start with the winners:
The article provides a list of the major retailers. It's not pretty.
We have to watch retail sales very closely over the next few months to see about the consumer's overall health.
Subscribe to:
Posts (Atom)