Saturday, June 30, 2007
This Chart Says It All
This is from Barron's weekly stock market report (subscription required). Notice the market hit intra-day highs 4 times last week, but could not hold these highs to the close.
Friday, June 29, 2007

Construction Spending Increases
From CBS MarketWatch:
Here's a link to the complete report
Some interesting points.
1.) A year ago, nonresidential construction was 44.28% of total construction spending. Now that total is 52.72%. Obviously, this means nonresidential spending is now just as important if not more so than residential spending.
2.) There was an across-the-board increase in all areas of business spending -- hospitals, amusements, water, roads, power, communication, etc.... Some of this is probably due to seasonal factors. It's easier to build things in the summer than the winter.
3.) There's been speculation about how the housing slowdown would impact construction employment. It now appears that the ramping up in business spending has helped to alleviate a slowdown in residential hiring. Total construction employment has decreased slightly, but not precipitously. So long as business continues to spend at current rates, this trend will probably continue.
Spending on U.S. construction projects jumped 0.9% in May, the most since February 2006, boosted by hefty gains in spending on federal and private nonresidential construction projects.
The gain outpaced economists' expectations. Analysts surveyed by MarketWatch were expecting construction spending to rise by just 0.1% in May. See Economic Calendar.
Spending on federal projects climbed by 4.1%, the most since October 2006, the Commerce Department reported.
Private nonresidential construction spending rose by 2.7% in May. Public construction spending, meanwhile, rose by 2.2%.
Once again, however, spending on private residential projects like homes and apartment buildings dropped, reflecting a still-weak housing market. Outlays on private residential projects fell by 0.8% in May, following a decline of 0.4% in April.
Here's a link to the complete report
Some interesting points.
1.) A year ago, nonresidential construction was 44.28% of total construction spending. Now that total is 52.72%. Obviously, this means nonresidential spending is now just as important if not more so than residential spending.
2.) There was an across-the-board increase in all areas of business spending -- hospitals, amusements, water, roads, power, communication, etc.... Some of this is probably due to seasonal factors. It's easier to build things in the summer than the winter.
3.) There's been speculation about how the housing slowdown would impact construction employment. It now appears that the ramping up in business spending has helped to alleviate a slowdown in residential hiring. Total construction employment has decreased slightly, but not precipitously. So long as business continues to spend at current rates, this trend will probably continue.
Consumer Spending Increases .5%; Core PCE At .1%
From Bloomberg:
Right now Bernanke is looking pretty damn good to the financial markets. For the last year he has been saying that core inflation would decrease as the economy slowed and it more or less has. In addition, when he came into office there was concern about his inflation fighting credentials. However, the Fed has continued to state over the last year that it's primary concern was inflation. In short, he should be gaining the markets trust right now.
Consumer spending in the U.S. rose less than forecast in May and the Federal Reserve's preferred inflation gauge cooled, a sign moderating growth is restraining price pressures.
The 0.5 percent rise in spending matched the gain in April, the Commerce Department said today in Washington. Core prices, which exclude food and fuel costs, rose at the slowest pace since March 2004 in the year ended May.
The figures may comfort Fed policy makers, who said yesterday that inflation remained their biggest concern pending more evidence of a sustained moderation in prices. Treasury securities extended their gains, with benchmark 10-year notes heading for the first back-to-back weekly advance since March.
``There has been a clear slowing in core prices the past few months, but as the Fed cautioned yesterday, it remains to be seen whether that is sustainable,'' said James O'Sullivan, a senior economist at UBS Securities LLC in Stamford, Connecticut. ``Consumer spending has slowed pretty decisively in the second quarter.'' O'Sullivan correctly forecast the gain in spending.
Right now Bernanke is looking pretty damn good to the financial markets. For the last year he has been saying that core inflation would decrease as the economy slowed and it more or less has. In addition, when he came into office there was concern about his inflation fighting credentials. However, the Fed has continued to state over the last year that it's primary concern was inflation. In short, he should be gaining the markets trust right now.
Thursday, June 28, 2007
A Weekly Look At the SPYs
Here is a 5-year chart of the SPYs, this time using a weekly chart and the MACD. Notice the last time the MACD was at this level was after an impressive gain -- the index ran from about 82 to 115 over a 12 month period, or an overall gain of 40.24%. After that run, the index consolidated for six months.
This time, the index rose from 125 to 150, or an increase of 20% over 12 months.
This time, the index rose from 125 to 150, or an increase of 20% over 12 months.
Fed's Statement
The Federal Open Market Committee decided today to keep its target for the federal funds rate at 5-1/4 percent.
Economic growth appears to have been moderate during the first half of this year, despite the ongoing adjustment in the housing sector. The economy seems likely to continue to expand at a moderate pace over coming quarters.
Readings on core inflation have improved modestly in recent months. However, a sustained moderation in inflation pressures has yet to be convincingly demonstrated. Moreover, the high level of resource utilization has the potential to sustain those pressures.
In these circumstances, the Committee's predominant policy concern remains the risk that inflation will fail to moderate as expected. Future policy adjustments will depend on the evolution of the outlook for both inflation and economic growth, as implied by incoming information.
Do I know my Fed, or do I know my Fed? /end self-congratulation phase.
Bonddad's Fed Prediction
OK -- I'm going on the record.
1.) The Fed won't raise raise rates (this is a no brainer).
2.) There will be a statement that inflation is still the Fed's main concern.
1.) The Fed won't raise raise rates (this is a no brainer).
2.) There will be a statement that inflation is still the Fed's main concern.
Kia Motors Pulls Debt Offering
There has been a rash of deals getting pulled off the market lately. Kia is just the latest example:
The total amount of debt being taken off the market is increasing:
And this is starting to hit the M&A activity that has helped to drive the market higher:
Awhile ago I agree with a statement from Jim Cramer about when the M&A activity would end. He gave five things to look for:
While I don't think pulling an offering for lack of interest or increased caution on the part of lenders would apply as Cramer intended, it still qualifies. We've had a ton of deals pulled over the last week or so.
Here is something to consider: how long does the deal pulling have to go on? My thoughts here are right now we are seeing a backlash caused by the Bear Stearns situation. However, how long will the backlash last? We may simply be in a period when the markets get wary, only to see the recent spate of caution thrown to the wind a bit after the Bear shock wears off. Profit potential has a way of helping people do away with things like covenants.
Kia Motors Corp., South Korea's second-largest automaker, canceled a $500 million bond sale for this week as skittish investors cut demand for riskier assets.
The total amount of debt being taken off the market is increasing:
At least eight companies from Kohlberg Kravis Roberts & Co. in New York to steelmaker Arcelor Mittal in Rotterdam, Netherlands, pulled more than $3 billion of debt sales amid concern that losses from bonds backed by U.S. subprime mortgages will spread to other markets. Caliber Global Investment Ltd., a $908 million hedge fund, said today it will close after losses.
``This may mark a tipping point in the credit cycle,'' said Robert Appleby, who helps manage $2 billion at ADM Capital in Hong Kong. ``If we see a shakeout, it will be a healthy one because it will prevent deals from being priced incorrectly.''
And this is starting to hit the M&A activity that has helped to drive the market higher:
Mergers and acquisitions are increasing at the slowest pace since January. Companies announced about $304 billion of takeovers this month, half the amount in April or May. Leveraged buyouts, where firms use mostly borrowed money to fund acquisitions, account for 21 percent of this year's mergers.
Awhile ago I agree with a statement from Jim Cramer about when the M&A activity would end. He gave five things to look for:
1. Interest rates on the long end going to at least 6%-7%. At that point, I believe it will get too risky.
2. The equity market being closed to the IPOs of the companies that need to be flipped. It's wide open right now.
3. Not one, not two, but maybe three or four, or even five deals going bust. Can't we wait for even one to go belly-up before we get too nervous?
4. Valuations ramping up more. With the S&P 500 selling for about 17.5 times next year's earnings, there is plenty of room to keep buying.
5. Private equity funds running out of money. Very unlikely.
While I don't think pulling an offering for lack of interest or increased caution on the part of lenders would apply as Cramer intended, it still qualifies. We've had a ton of deals pulled over the last week or so.
Here is something to consider: how long does the deal pulling have to go on? My thoughts here are right now we are seeing a backlash caused by the Bear Stearns situation. However, how long will the backlash last? We may simply be in a period when the markets get wary, only to see the recent spate of caution thrown to the wind a bit after the Bear shock wears off. Profit potential has a way of helping people do away with things like covenants.
Final GDP Comes In at .7% Increase
From the BEA:
This should come as no real surprise. While the upward tick is nice, it still indicates growth in the first quarter was terrible.
Let's look a bit deeper into the numbers to see what we have.
Because PCEs account for 70% of GDP growth, it's imperative for this number to grow in order for the economy as a whole to grow. That makes this increase a welcome development. Durable goods expenditures increase at an 8.7% SAAR, while expenditures for nondurable goods increased 3.2% SAAR and expenditures for services increased at a 3.8% SAAR. These are all solid numbers.
Residential investment decreased at a 15.8% SAAR.
Nonresidential construction is now slightly larger than residential construction according to the Census Bureau's construction spending number. That means nonresidential spending is helping to alleviate the problems associated with the housing downturn. However, gross private domestic investment still decreased at a 9.6% SAAR.
Hopefully by now everybody knows that I think the core inflation argument is garbage. However, the Fed will look at that number and not be happy. Core inflation increased from from 2.4% to 2.9%. In addition, the price index for PCE's increased 3.5%. This will also make the Fed unhappy.
Short version:
Good: The Consumer is still spending at a strong rate and growth ticked up a bit.
Bad: PCE prices increased, investment was low, housing is still in a recession. It's not the best of reports.
Real gross domestic product -- the output of goods and services produced by labor and property located in the United States -- increased at an annual rate of 0.7 percent in the first quarter of 2007, according to final estimates released by the Bureau of Economic Analysis. In the fourth quarter, real GDP increased 2.5 percent.
This should come as no real surprise. While the upward tick is nice, it still indicates growth in the first quarter was terrible.
Let's look a bit deeper into the numbers to see what we have.
Real personal consumption expenditures increased 4.2 percent in the first quarter, the same increase as in the fourth quarter.
Because PCEs account for 70% of GDP growth, it's imperative for this number to grow in order for the economy as a whole to grow. That makes this increase a welcome development. Durable goods expenditures increase at an 8.7% SAAR, while expenditures for nondurable goods increased 3.2% SAAR and expenditures for services increased at a 3.8% SAAR. These are all solid numbers.
Real nonresidential fixed investment increased 2.6 percent, in contrast to a decrease of 3.1 percent. Nonresidential structures increased 4.8 percent, compared with an increase of 0.8 percent.
Residential investment decreased at a 15.8% SAAR.
Nonresidential construction is now slightly larger than residential construction according to the Census Bureau's construction spending number. That means nonresidential spending is helping to alleviate the problems associated with the housing downturn. However, gross private domestic investment still decreased at a 9.6% SAAR.
The price index for gross domestic purchases, which measures prices paid by U.S. residents, increased 3.7 percent in the first quarter, 0.1 percentage point more than the preliminary estimate; this index increased 0.2 percent in the fourth quarter. Excluding food and energy prices, the price index for gross domestic purchases increased 2.9 percent in the first quarter, compared with an increase of 2.4 percent in the fourth. About 0.2 percentage point of the first-quarter increase in the index was accounted for by the pay raise for federal civilian and military personnel, which is treated as an increase in the price index of employee services purchased by the federal government.
Hopefully by now everybody knows that I think the core inflation argument is garbage. However, the Fed will look at that number and not be happy. Core inflation increased from from 2.4% to 2.9%. In addition, the price index for PCE's increased 3.5%. This will also make the Fed unhappy.
Short version:
Good: The Consumer is still spending at a strong rate and growth ticked up a bit.
Bad: PCE prices increased, investment was low, housing is still in a recession. It's not the best of reports.
Are the Financial Markets Able to Withstand Recent Shocks?
Over the last few days there's been a lot of discussion about a possible change in overall market sentiment. It started with the problems at the Bear Hedge funds. This was followed by several large canceled debt deals because borrowers demanded stricter lending terms. From today's WSJ:
However, as another WSJ article notes, these events are not probably not fatal:
Right now it appears market segments are at the beginning of a transition. As recent press reports indicate the super-easy credit terms of recent buy-outs are disappearing. Lenders and investors are demanding more loan covenants and in some cases higher interest rates. But lenders and investors don't appear to be asking for unreasonable terms. Instead, they appear to be asking for terms that would have been included in deals 5 or more years ago. In other words, borrowers have had it extremely easy over the last few years and will now have to pony up more conservative borrowing terms in their deals.
In addition, I have argued before that interest rates are far from restrictive. Here is a chart of the 10 year constantly maturing Treasury.
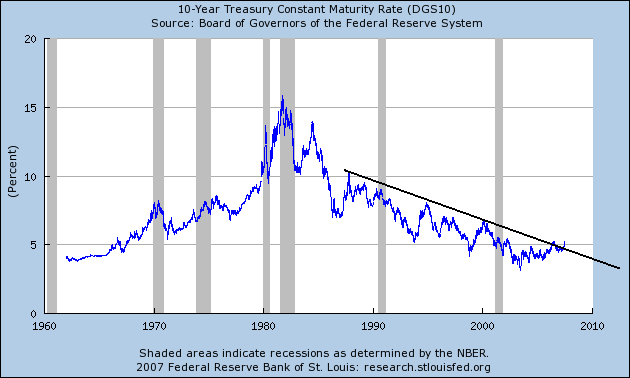
Interest rates have been higher during previous expansions and deals still got done and the economy still expanded at a strong rate. Over the last few years borrowers have gotten used to historically low interest rates. Right now borrowers have to contend with the fact that these days of incredibly easy money are over. But 5% interest rates are far from fatal.
BCA research makes a similar point although from a different analytical angle:
Here they are arguing the increase in interest rates is simply the result of higher demand for funds. Considering the number of deals we have seen over the last few quarters, this makes sense. There is a ton of competition for funds right now, and borrowers are having to compete with each other to get lenders attention.
So short version, the Bear problems probably started a transition period in the debt markets. Super easy credit terms are over. But lenders and investors don't appear to be asking for unreasonable terms. My guess is this change will weed out some of the more questionable deals but allow the solid ideas to continue.
For the other side of this argument, see this article at the Big Picture. As always, Barry makes some very good points.
There wasn't any similar-sized stumble yesterday. But Catalyst Paper Corp., citing "adverse" market conditions, scrapped a $200 million offering of junk bonds the Canadian company planned to use for funding its business and other investments or acquisitions.
Meanwhile, underwriters delayed the launch of a buyout-financing deal for Myers Industries Inc. in the hope that the market would settle down in coming days. Late in the day, Magnum Coal Co. became the latest company to postpone a junk-bond offering, this one for $350 million.
In Europe, Arcelor Finance, the borrowing vehicle for Arcelor SA, which is being acquired by Mittal Steel Co., put off its plans to issue more than €1 billion ($1.34 billion) in bonds, citing the turbulent debt market. In Malaysia, shipping company MISC Bhd. put plans for a $750 million bond offering on the back burner.
In another sign that investors may be developing some indigestion from the buyout boom, Blackstone Group, the buyout firm that listed shares on the New York Stock Exchange last week, fell 2.7% in 4 p.m. composite trading yesterday to $29.92, below its offer price of $31 a share.
However, as another WSJ article notes, these events are not probably not fatal:
Part of the answer lies in the strength of the financial system's shock absorbers, which have improved since 1987, the 1997 Asian financial crisis, the 1998 Long-Term Capital mess and Sept. 11 attacks. Hedge fund Amaranth Advisors collapsed without many side effects. It looks like the same may go for the two Bear Stearns funds, whatever their fate.
Recent history is encouraging. The 1987 stock-market crash, as frightening as it was, didn't tank the U.S. economy. Neither did the horror of the Sept. 11 attacks. The economy gulped and then rebounded. That isn't any guarantee that the next crash or crisis, and there will be one someday, will have similarly passing effects on the impressively resilient U.S. economy. But it is encouraging.
Right now it appears market segments are at the beginning of a transition. As recent press reports indicate the super-easy credit terms of recent buy-outs are disappearing. Lenders and investors are demanding more loan covenants and in some cases higher interest rates. But lenders and investors don't appear to be asking for unreasonable terms. Instead, they appear to be asking for terms that would have been included in deals 5 or more years ago. In other words, borrowers have had it extremely easy over the last few years and will now have to pony up more conservative borrowing terms in their deals.
In addition, I have argued before that interest rates are far from restrictive. Here is a chart of the 10 year constantly maturing Treasury.
Interest rates have been higher during previous expansions and deals still got done and the economy still expanded at a strong rate. Over the last few years borrowers have gotten used to historically low interest rates. Right now borrowers have to contend with the fact that these days of incredibly easy money are over. But 5% interest rates are far from fatal.
BCA research makes a similar point although from a different analytical angle:
Increases in borrowing costs can typically be differentiated as reflective or restrictive. Reflective rises in yields are a product of vibrant growth. In order to keep investment and savings in balance, higher rates should accompany the increase in desired investment relative to desired savings. Eventually, a tipping point occurs in financial markets, at which point rises in bond yields hamper the economic expansion. While it is not easy to time this event, one variable to watch is the gap between GDP growth and interest rates. Based on this measure, it appears that interest rates are not yet restrictive. Consistently, share prices should perform well so long as rises in yields remain indicative of strong growth and an inflation scare does not develop. Bottom line: It will take a much sharper rise in the cost of debt to curtail the bull market in global equities. Until then, our outlook for higher stock prices remains intact.
Here they are arguing the increase in interest rates is simply the result of higher demand for funds. Considering the number of deals we have seen over the last few quarters, this makes sense. There is a ton of competition for funds right now, and borrowers are having to compete with each other to get lenders attention.
So short version, the Bear problems probably started a transition period in the debt markets. Super easy credit terms are over. But lenders and investors don't appear to be asking for unreasonable terms. My guess is this change will weed out some of the more questionable deals but allow the solid ideas to continue.
For the other side of this argument, see this article at the Big Picture. As always, Barry makes some very good points.
Wednesday, June 27, 2007
Health Care to the Rescue?
Here is the same type of chart as the XLF below. It's a three year chart of the health care ETF (XLV) with the MACD. Notice the MACD has been at this level or below 6 times in the last three years including this time. The index rebounded strongly 4 of those times and the fifth time it rebounded after about 2 months.
This play makes more sense in the current market. Health care may benefit from a more risk adverse investor.
This play makes more sense in the current market. Health care may benefit from a more risk adverse investor.
Will The Financials Snap Back?
Here is a 3 year chart of the XLF tracking stock plus the MACD indicator. Notice that each time the MACD has touched the -.2 level over the last 3 years, the XLF has snapped back with a fairly decent gain over the next few months. Because financials are the largest sector in the S&P 500, this could bode well for the coming months.
However, it's important to remember a basic point. Technical analysis is not an exact science. There is no guarantee the XLF will come back from its current levels like it has in the past. The fundamental background is very different this time. Financials have the misfortune of being involved in the structured finance business at a time when we have a fair amount of negative news in that sector. The WSJ has run a series of articles on the structured finance market that highlighted the concerns about the sector. Bear Stearns hedge fund problems drove the market lower last week and still hang over the market this week.
In addition, Bank of America comprises 8% of this ETF. BAC made a comment over the last two weeks that the recent mortgage problems were the tip of the iceberg. Merrill Lynch -- a Bear Stearns creditor is 2.79% of this ETF. Also remember the earnings season is about to start. As Barron's noted today:
In short -- there are alot of fundamental reasons for financials recent fall and for this index to underperform over the next few months.
However, it's important to remember a basic point. Technical analysis is not an exact science. There is no guarantee the XLF will come back from its current levels like it has in the past. The fundamental background is very different this time. Financials have the misfortune of being involved in the structured finance business at a time when we have a fair amount of negative news in that sector. The WSJ has run a series of articles on the structured finance market that highlighted the concerns about the sector. Bear Stearns hedge fund problems drove the market lower last week and still hang over the market this week.
In addition, Bank of America comprises 8% of this ETF. BAC made a comment over the last two weeks that the recent mortgage problems were the tip of the iceberg. Merrill Lynch -- a Bear Stearns creditor is 2.79% of this ETF. Also remember the earnings season is about to start. As Barron's noted today:
WITH ANOTHER EARNINGS SEASON ABOUT to kick off, health care, technology, heavy industry, and even the fickle energy sector could be Corporate America's pennant winners.
Energy companies in particular could hit a big homerun off rising oil prices and low expectations in the second quarter.
"The rationale here is that earnings growth leads stock prices," says Michael Thompson, director of research at Thomson Financial. "Stock prices reflect good earnings and these are places where you will find it."
If that's the case, some financial stocks might be best left on the bench right next to home builders, auto makers and several retailers.
In short -- there are alot of fundamental reasons for financials recent fall and for this index to underperform over the next few months.
Durable Goods Orders Decrease
From the Census Bureau:
From Bloomberg:
The drop in new orders from the previous month was widespread. Primary metals dropped 3.6%, fabricated metal parts dropped 1%, machinery dropped 1.6%, electrical equipment, supplies and components dropped 3.9%, nondefense aircraft and parts dropped 22.7%.
However, it's important to note these two points.
1.) This is the first drop over the last 4 months. No indicator goes up forever. Buyers could simply be absorbing previous purchases. This makes sense considering the April number was revised up to an increase of 1.1%.
2.) Year to date total new orders are up .5%, excluding transportation are down .3% and excluding defense are up .2%. In other words, we're close to year ago levels for all of the macro-level orders numbers. While businesses aren't seriously increasing their investment, they're also not seriously decreasing their investment.
For those of us who thought business investment would pick-up this year (which includes me) this flashes a yellow warning light. It's not fatal to that conclusion. But another month like this and that conclusion may be called into question.
New orders for manufactured durable goods in May decreased $6.1 billion or 2.8 percent to $213.0 billion, the U.S. Census Bureau announced today. This followed three consecutive monthly increases including a 1.1 percent April increase. Excluding transportation, new orders decreased 1.0 percent. Excluding defense, new orders decreased 3.2 percent.
From Bloomberg:
Orders for U.S. durable goods fell more than forecast in May, casting doubt on the strength of a projected rebound in business investment.
Demand for goods meant to last several years fell 2.8 percent, the first drop in four months, after a revised 1.1 percent gain in April that was larger than previously estimated, the Commerce Department said today in Washington. Excluding transportation equipment, orders dropped 1 percent after rising 2.5 percent.
The decline was led by fewer orders for aircraft, metals, and machinery. A reluctance to buy new equipment, along with a lingering housing slump, may call into question Federal Reserve forecasts for gradual improvement in the economy the rest of this year, economists said. Policy makers, meeting today and tomorrow, are projected to hold interest rates unchanged.
``It's clear that businesses are still somewhat risk averse and that they are being cautious in light of the softness in the economy,'' said Nariman Behravesh, chief economist at Global Insight Inc. in Lexington, Massachusetts. ``Capital spending is not moving forward with the strength we had hoped.''
The drop in new orders from the previous month was widespread. Primary metals dropped 3.6%, fabricated metal parts dropped 1%, machinery dropped 1.6%, electrical equipment, supplies and components dropped 3.9%, nondefense aircraft and parts dropped 22.7%.
However, it's important to note these two points.
1.) This is the first drop over the last 4 months. No indicator goes up forever. Buyers could simply be absorbing previous purchases. This makes sense considering the April number was revised up to an increase of 1.1%.
2.) Year to date total new orders are up .5%, excluding transportation are down .3% and excluding defense are up .2%. In other words, we're close to year ago levels for all of the macro-level orders numbers. While businesses aren't seriously increasing their investment, they're also not seriously decreasing their investment.
For those of us who thought business investment would pick-up this year (which includes me) this flashes a yellow warning light. It's not fatal to that conclusion. But another month like this and that conclusion may be called into question.
Is Credit Drying Up
From the WSJ:
From Bloomberg:
Very little has been written about the actual terms in the wave of M&A that has occurred over the last few years. However, the WSJ makes it clear that financing terms were more liberal than deals from previous waves of M&A. This easing of terms is one of the end results of low interest rates. Low interest rates make investors hungry for better returns. It also makes investors more willing to take on more risk to get those returns. AS a result, they accept more liberal financing terms.
The yen carry trade was considered a lay-up investment for the last few years. The trade was simple. Borrow money in Japan where interest rates were ultra-cheap and lend the money in a market where interest rates were higher. Now it looks as thought that trade is going away as well.
If both of these developments continue then a primary driver of the US markets over recent months -- high powered M&A deals -- may diminish in importance. That in turn could effect a possible recovery from the recent sell-off in the US markets.
Underwriters pulled a $1.55 billion bond offering by U.S. Foodservice, the nation's second-largest food distributor. The company also postponed plans to sell $2 billion in loans to fund the deal, according to people familiar with the matter. For now, the banks involved in underwriting the deal will have to lend the $3.6 billion directly to U.S. Foodservice, which is being bought from Royal Ahold NV of the Netherlands.
....
While the banks will try to resell the loans and bonds to investors in the year ahead, the FoodService deal could reset the equilibrium of the buyout business at large, giving banks more clout in financing negotiations while also putting strains on the amount of money available for deals. One person involved in the deal described it as a "healthy correction" for an overheated market.
Big buyouts in the past few years have been fueled by bond and loan investors who have been willing to accept skimpy interest rates and easy terms on the companies borrowing from them. But in a wave of midsize debt deals that hit the market in the past week, investors have shoved deals back to underwriters, demanding better terms.
From Bloomberg:
The yen rose the most in 10 weeks against the euro as investors pared holdings of emerging-market bonds and stocks funded by loans in the Japanese currency.
Japan's yen gained against all 16 of the most-active currencies, extending its rally after Finance Minister Koji Omi yesterday stressed the risk of one-way foreign-exchange bets. Stocks in Europe and Asia declined as investors shunned riskier assets, prompting an unwinding of the so-called carry trade.
``The combination of a very clear change of stance towards the currency markets within Japan's Ministry of Finance along with continued losses for global equity markets is taking its toll,'' said Simon Derrick, chief currency strategist at Bank of New York in London. ``Yen-funded carry trades are experiencing a sharp unwinding.''
Very little has been written about the actual terms in the wave of M&A that has occurred over the last few years. However, the WSJ makes it clear that financing terms were more liberal than deals from previous waves of M&A. This easing of terms is one of the end results of low interest rates. Low interest rates make investors hungry for better returns. It also makes investors more willing to take on more risk to get those returns. AS a result, they accept more liberal financing terms.
The yen carry trade was considered a lay-up investment for the last few years. The trade was simple. Borrow money in Japan where interest rates were ultra-cheap and lend the money in a market where interest rates were higher. Now it looks as thought that trade is going away as well.
If both of these developments continue then a primary driver of the US markets over recent months -- high powered M&A deals -- may diminish in importance. That in turn could effect a possible recovery from the recent sell-off in the US markets.
Tuesday, June 26, 2007
Three More Charts
There are three more charts in addition to the SPYs that should cause concern.
Financials comprise 20% of the S&P 500. The last week of trading has really taken of toll on this sector. Today it closed below it's 200 day SMA. Also note that volume has been heavy the last three days, indicating traders are getting out of the sector largely because of the issues in the subprime market. Because this sector is such a large portion of the S&P, this will really impair the S&P 500s ability to rally.
Energy and basic materials have been an important ingredient in the latest rally. Notice the energy ETFs closed below their 20 day SMA with a strong downward moving bar and pretty heavy volume.
Notice that basic materials closed below their 50 day SMA on very large volume.
So we have the S&P and three of its most important sectors in a bad place right now.
The SPY Chart
Here is a chart of the SPYs that included today's close. Notice a few important things.
1.) The SPYs closed below support established in early June
2.) The average is below the 50 day SMA
3.) The last three days of selling have occurred on high volume.
In addition, note the post below. Two technical indicators (the MACD and CMF) are negative and the OBV is neutral.
This is what a market that is correcting looks like.
Three Technical Indicators and the SPYs
Here are three charts of the SPY with a separate technical indicator.
The daily MACD is declining, and has been declining since early May:
The Chaiken Money Flow indicates money is leaving the market and has been for about a month:
The on balance volume has been neutral for some about the same length of time.
The daily MACD is declining, and has been declining since early May:
The Chaiken Money Flow indicates money is leaving the market and has been for about a month:
The on balance volume has been neutral for some about the same length of time.
Home Prices Drop The Most In 16 Years; New Home Sales Fall
From CBS Marketwatch:
Also From Marketwatch:
There is absolutely nothing good in any of these reports. Declining sales and prices + high inventory levels + lower earnings from homebuilders + bearish forecasts from homebuilders = a really bad situation in the housing market. And it's just getting worse.
I want to add the following questions.
So far, the US housing market problems have not bled over into consumer spending. In addition, while we have seen subprime lenders go bankrupt at high rates, a decline in housing stocks, a huge pile-up in new and existing homes inventory for sale and now a hedge fund with exposure to subprime mortgages having big problems. However, the economy at large is still operating fairly well.
Here's the question: how much stress can the US economy take from housing? It's already taken a lot. But -- where's the breaking point? The more the negative housing news piles up the closer we get.
Home prices in 10 major U.S. cities dropped at the fastest pace in 16 years during the 12 months ending in April, according to Standard & Poor's Case-Shiller home price index released Tuesday.
Home prices in the 10 cities fell 2.7% on a year-over-year basis, the largest decline since September 1991. Meanwhile, prices in 20 cities dropped a record 2.1% year over year.
Price appreciation has slowed for 17 consecutive months. Nationally, prices have doubled since 2000.
Fourteen of the 20 cities showed falling prices in the past year, led by Detroit (down 9.3%), San Diego (down 6.7%) and Washington (down 5.7%). Seattle had the largest price gains over the past year at 9.6%, while prices are up 7% in Charlotte, N.C., and 6.4% in Portland, Ore.
"No region is immune to weakening price returns," said Robert Shiller, chief economist for MacroMarkets LLC and the co-creator of the index. Even in regions such as the Pacific Northwest or the Southeast, where prices are still rising, the gains have been slowing.
# Atlanta: up 0.8% in April, up 2.1% year-on-year
# Boston: up 0.6% in April, down 4.5% year-on-year
# Charlotte: up 1.2% in April, up 7% year-on-year
# Chicago: down 0.7% in April, up 0.2% year-on-year
# Cleveland: down 0.2% in April, down 2.8% year-on-year
# Dallas: up 1.3% in April, up 2% year-on-year
# Denver: up 0.5% in April, down 1.8% year-on-year
# Detroit: down 2.5% in April, down 9.3% year-on-year
# Las Vegas: down 0.8% in April, down 3% year-on-year
# Los Angeles: down 0.5% in April, down 2.6% year-on-year
# Miami: down 1.2% in April, down 1% year-on-year
# Minneapolis: down 0.5% in April, down 2.9% year-on-year
# New York: down 0.2% in April, down 1.5% year-on-year
# Phoenix: down 0.8% in April, down 4.5% year-on-year
# Portland: up 1% in April, up 6.4% year-on-year
# San Diego: down 0.3% in April, down 6.7% year-on-year
# San Francisco: up 0.2% in April, down 2.8% year-on-year
# Seattle: up 1.3% in April, up 9.6% year-on-year
# Tampa: down 1.1% in April, down 5% year-on-year
# Washington: down 0.5% in April, down 5.7% year-on-year
# 10-city composite: down 0.3% in April, down 2.7% year-on-year
# 20-city composite: down 0.2% in April, down 2.1% year-on-year
Also From Marketwatch:
U.S. new home sales fell 1.6% in May after surging in April to a seasonally adjusted annual rate of 915,000 units, the Commerce Department said Tuesday. Economists expected sales to fall to 930,000 units. At the same time, sales in February, March and April were revised down by 84,000 units. April's sales pace was revised to 930,000 units from the 981,000 units initially reported, a 12.5% rise from March's downwardly revised 827,000 annual pace. This is still the largest sales increase since September 1993. New home sales are down 15.8% in the past year. Inventories of unsold homes fell 1.1% to 536,000, representing a 7.1-month supply at the May sales pace. The supply of inventory peaked at 8.3 months in March. Inventories of unsold homes are down 5% in the past year. The median sales prices fell 0.9% in the past year to $236,100.
There is absolutely nothing good in any of these reports. Declining sales and prices + high inventory levels + lower earnings from homebuilders + bearish forecasts from homebuilders = a really bad situation in the housing market. And it's just getting worse.
I want to add the following questions.
So far, the US housing market problems have not bled over into consumer spending. In addition, while we have seen subprime lenders go bankrupt at high rates, a decline in housing stocks, a huge pile-up in new and existing homes inventory for sale and now a hedge fund with exposure to subprime mortgages having big problems. However, the economy at large is still operating fairly well.
Here's the question: how much stress can the US economy take from housing? It's already taken a lot. But -- where's the breaking point? The more the negative housing news piles up the closer we get.
Lennar Earnings Drop; Gives Weak Guidance
From Bloomberg:
Not much to add to this, is there? The housing market is clearly in a recession at this point. And with a massive inventory build-up, rising interest rates and tightening credit standards, the decline will continue for some time.
Lennar Corp., the largest U.S. homebuilder, reported a loss for the fiscal second quarter as the housing slowdown discouraged buyers and prompted price reductions.
The net loss amounted to $244.2 million, or $1.55 a share, in the three months ended May 31, compared with a profit of $324.7 million, or $2, a year earlier, Miami-based Lennar said today in a statement. Revenue tumbled to $2.88 billion from $4.58 billion.
Rising defaults among subprime borrowers and mortgage rates near an 11-month high are hampering sales for homebuilders even as they cut prices. The slump in housing has moved into its second year as prospective buyers hold off purchasing in anticipation prices will continue to fall.
``As we look to our third quarter and the remainder of 2007, we continue to see weak, and perhaps deteriorating, market conditions,'' Chief Executive Officer Stuart Miller said in the statement. ``We currently expect to be in a loss position in our third quarter.''
Not much to add to this, is there? The housing market is clearly in a recession at this point. And with a massive inventory build-up, rising interest rates and tightening credit standards, the decline will continue for some time.
Refineries Are Shutting Down Longer Adding to High Gas Pressures
From the WSJ:
I've spent a fair amount of time talking about gas prices for two reasons.
1.) Consumers see these prices every day and have to pay them at least once a week if not more. As a result, higher prices could have a direct result on consumer spending.
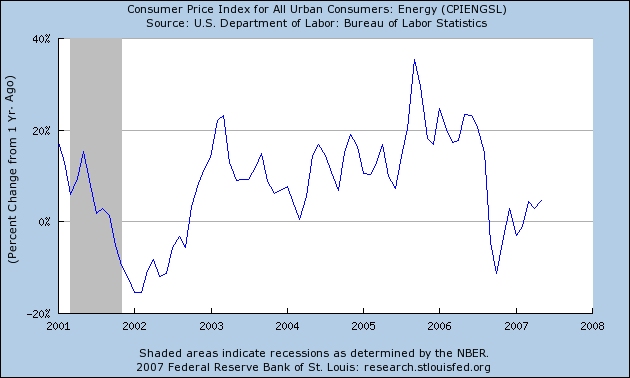
2.) Higher gas prices increase the total inflation rate. Here is a chart from the St. Louis Federal Reserve of the year over year change in the inflation rate for energy since 2001. This chart indicates energy prices have been increasing at high rates for the last 7 years.
So far, consumer spending as expressed by personal consumption expenditures has increased smartly, indicating high gas prices aren't hitting total spending. However, it's important to keep an eye on this situation.
In addition, it appears there are serious problems developing with the US refining industry. They have run a near full capacity during previous years, yet the wear and tear is starting to take a toll.
Refiners say there are a variety of reasons behind the lingering outages, including tougher federal clean-fuel standards. But industry observers also cite wear and tear on aging equipment in a nation where no new refinery has been built since the 1970s.
Because capacity hasn't grown as much as demand in the past few years, refiners have been running their equipment harder and for longer periods without maintenance, making for extended shutdowns when they do stop to fix things. A shortage of skilled labor is also pushing maintenance projects, normally scheduled in the winter or the spring, into the summer months. The strains point to a lingering trouble spot in the nation's energy stream at a time when Americans show little sign they will curb gasoline use anytime soon.
.....
The shutdowns have put a growing portion of the nation's oil-refining capacity -- currently 17.5 million barrels a day -- out of circulation at a time when demand is at its highest. The Energy Information Administration recently said the refinery utilization rate had sunk to 87.6%. On average, refineries used about 94% of their capacity this time of year from 2001 to 2005. Even last year, when refineries were still recovering from damage suffered during hurricanes Katrina and Rita in 2005, the utilization rate ran at 93%.
While the public is groaning about high gasoline prices, refiners have seen their profit margins soar. In the first quarter, the major gasoline producers in the U.S. made about $10 billion in refining profits domestically and abroad, up 50% from a year earlier. Daniel Barcelo, an analyst with Banc of America Securities, expects refining margins, or the difference between the price refiners pay for oil and the prices their fuels fetch, to be even higher in the second quarter.
I've spent a fair amount of time talking about gas prices for two reasons.
1.) Consumers see these prices every day and have to pay them at least once a week if not more. As a result, higher prices could have a direct result on consumer spending.
2.) Higher gas prices increase the total inflation rate. Here is a chart from the St. Louis Federal Reserve of the year over year change in the inflation rate for energy since 2001. This chart indicates energy prices have been increasing at high rates for the last 7 years.
So far, consumer spending as expressed by personal consumption expenditures has increased smartly, indicating high gas prices aren't hitting total spending. However, it's important to keep an eye on this situation.
In addition, it appears there are serious problems developing with the US refining industry. They have run a near full capacity during previous years, yet the wear and tear is starting to take a toll.
And Then There Were Two
As in funds with problems because of the subprime market:
The WSJ also noted this fund is a story today on Bear Stearns:
Here's the complete story off the Dow Jones News Wire:
So the company sold the non-performing assets. What price did they get? And who bought them?
.....
LONDON (Thomson Financial) - Queen's Walk Investment Ltd posted a net loss for the year ended March 31 mainly as a result of fair value adjustments made to
investments in 2007.
The group posted a net loss of 67.7 mln eur for the full year while net asset value decreased to 7.24 eur as at March 31, 2007 from 9.90 eur as at Dec 31, 2006. It had reported a net profit of 9.77 mln eur for the period from Sept 6, 2005 to March 31, 2006.
The first full-year results as a public company reflect a period of exceptional turbulence in many of the asset-backed securities markets in which the company has invested, primarily during the fourth quarter of the financial year, chairman Tom Chandos said.
The WSJ also noted this fund is a story today on Bear Stearns:
And, Queen's Walk Investment Ltd., a United Kingdom-based publicly traded closed-end fund managed by Cheyne Capital Management (U.K.) LLP, said it had a net loss of €67.7 million ($91.2 million) in the first quarter and a loss of €98.8 million in the fourth quarter, due to losses in the mortgage-backed bond market. The net asset value of the securities in the fund fell 26.8%. More broadly, bond markets show signs of trouble digesting recent issues of corporate debt.
Here's the complete story off the Dow Jones News Wire:
Monday, it said it had marked down by half the value of its U.S. assets, in the latest setback for the banks and hedge funds that had been betting on much-lower delinquency rates from U.S. home loan borrowers with poor credit histories
.....
Stuart Fiertz, a founder of Cheyne Capital, told Dow Jones Newswires he isn't anticipating further pain in Queen's Walk's U.S. subprime portfolio, mainly because it has sold three of its four U.S. subprime mortgage positions, reducing the size of its overall portfolio to around EUR319.9 million as of May 31.
That reduced the U.S. subprime portion of its portfolio from 12% to 3%, though it still has exposure to higher-quality tranches of U.S. mortgage-backed securities.
So the company sold the non-performing assets. What price did they get? And who bought them?
.....
Monday, June 25, 2007
SEC Investigates Bear Fund
From Business Week
Bear Stearns (BSC) may have a lot of explaining to do about a big restatement of losses at one of its troubled hedge funds—and not just to its investors. BusinessWeek has learned that the Securities & Exchange Commission recently opened a preliminary inquiry into the near-collapse of Bear Stearns' High-Grade Structured Credit Strategies Enhanced Leveraged Fund. People familiar with the inquiry say regulators are interested in learning how the Wall Street investment firm came to dramatically restate the April losses for the 10-month-old fund, which invested heavily in securities backed by subprime mortgages, or home loans to consumers with shaky credit histories.
....
A spokesman for the SEC declined to comment, as did a Bear Stearns spokesman. But people familiar with the inquiry say lawyers from the SEC's main office in Washington are beginning to gather information about the troubling series of events at the hedge fund.
.....
But the magnitude of the April restatement is raising eyebrows on Wall Street. Mortgage and bond traders say that while the banks may have contributed to some of Bear Stearns' higher losses, it's unlikely they were the complete cause of the restatement. Some have speculated that Bear Stearns may have had to recalculate the price of its subprime-backed bonds after liquidating some assets to honor earlier investor redemptions. Others says Bear Stearns' system for modeling the value of its subprime securities may have been too optimistic, prompting the hedge funds' auditors to raise questions about the methodology and forcing recalculations.
......
To be sure, it's worth noting that the SEC inquiry is so preliminary that regulators have not issued any subpoenas. It's not uncommon for the SEC to open investigations after hedge-fund blowups. Last fall, the SEC's Boston office began examining the collapse of Amaranth Advisors , a hedge fund that lost nearly $6 billion from a series of wrong-way bets on the natural gas market. To date, nothing has come of that inquiry. The fund shut down in 2006.
Bear to Close Hedge Funds?
From CNBC:
Bear isn't commenting because they are too busy trying to figure out what to do.
This developing situation leads to some really nasty possibilities.
1.) If Bear liquidates, what will they do with the securities? According to news reports, the fund invests in the less liquid equity pieces of CDO deals. Because these tranches are less liquid, other funds that invest in these securities will suddenly have an actual market price that may not reflect the value the fund has on its respective securities. In other words, the possibility of Bear selling assets could send some unpleasant waves through the industry.
2.) What will this do to mortgage funding -- which is already drying up from a variety of sources? Credit standards are already tightening. This situation may simply tightened the situation up more, making it that much harder for borrowers to acquire money for a loan.
Two large hedge funds managed by investment bank and brokerage Bear Stearns are close to being shut down as their complex mortgage-related bets have soured, the Wall Street Journal reported.
The Journal said the two funds held over $20 billion of investments just a few weeks ago, mostly tied to risky securities linked to so-called subprime mortgages.
The two funds were identified by the Journal as the High Grade Structured Credit Strategies Enhanced Leverage Fund and the High Grade Structured Credit Strategies Fund.
Meanwhile, CNBC's Charlie Gasparino reported that the Securities and Exchange Commission is closely monitoring the unfolding hedge fund situation at Bear Stearns, though no formal inquiry has been announced. "If they (the SEC) feel this is getting much worse, you could see them go in and basically start an investigation and ask Bear Stearns, 'What did you know, and when did you know it, and when did you disclose that?'" Gasparino said.
The Journal report said Bear Stearns Bear Stearns Co Inc has been "besieged" by investors and lenders racing to pull their money out of the investment vehicles as the funds' performance has plummeted sharply.
Bear Stearns could not be reached for immediate comment by Agence France-Presse.
However, the financial group, told investors last week that its profits from mortgage-related trading had moderated significantly.
Bear isn't commenting because they are too busy trying to figure out what to do.
This developing situation leads to some really nasty possibilities.
1.) If Bear liquidates, what will they do with the securities? According to news reports, the fund invests in the less liquid equity pieces of CDO deals. Because these tranches are less liquid, other funds that invest in these securities will suddenly have an actual market price that may not reflect the value the fund has on its respective securities. In other words, the possibility of Bear selling assets could send some unpleasant waves through the industry.
2.) What will this do to mortgage funding -- which is already drying up from a variety of sources? Credit standards are already tightening. This situation may simply tightened the situation up more, making it that much harder for borrowers to acquire money for a loan.
Existing Home Sales Drop
From Bloomberg:
There are several points to make here:
1.) Inventory is increasing at absolute levels to "the most ever". Excess supply = decreasing prices. In addition,
2.) Prices dropped 2.1% from year ago levels, but inventory still increased. That means prices are going to have to drop a lot more to clear the inventory.
3.) It's interesting that sellers aren't taking their homes off the market because of lack of interest. Instead, more sellers are entering the market. While I don't have any proof of this, I have to think the only reason inventory is increasing is because people have to sell rather than want to sell. Again -- that's pure conjecture. But if you have something you want to sell but don't need to sell and no one is interested in buying what you want to sell, you usually don't offer it for sale.
4.) Either buyers or sellers are unrealistic about selling prices right now. Simply put, inventory isn't moving. Yet no one seems to be adjusting their prices to levels that do move inventory. At some point, we're going to see either large price drops to move inventory or people taking their houses off the market or a combination of both.
5.) Finally, we're just starting to see the effects of tightening lending standards right now. Fewer buyers = less demand = lower prices.
Sales of previously owned homes in the U.S. fell in May to the lowest level in almost four years, reinforcing concerns about a protracted housing slump.
Purchases declined 0.3 percent to an annual rate of 5.99 million, from a revised 6.01 million the prior month, the National Association of Realtors said today in Washington. The supply of unsold homes jumped to a record.
The housing recession, the worst since 1991, is the biggest threat to an economy that's otherwise showing signs of recovering from a yearlong slowdown. The growing number of homes on the market and higher interest rates may further discourage buyers, economists say.
``The slow bleed in housing continues,'' said Ethan Harris, chief U.S. economist at Lehman Brothers Holdings Inc. in New York. ``The inventory adjustment is going to be slow and painful. This means we're in for more pressure on prices and more pressure on construction.''
.....
The supply of homes for sale increased 5 percent to 4.43 million, the most ever. At the current sales pace, that represented 8.9 months' worth, the highest since June 1992 and up from 8.4 months' worth at the end of the prior month.
The median price of an existing home fell 2.1 percent last month from a year ago to $223,700, the 10th consecutive month of year-over-year declines, the Realtors group said.
There are several points to make here:
1.) Inventory is increasing at absolute levels to "the most ever". Excess supply = decreasing prices. In addition,
2.) Prices dropped 2.1% from year ago levels, but inventory still increased. That means prices are going to have to drop a lot more to clear the inventory.
3.) It's interesting that sellers aren't taking their homes off the market because of lack of interest. Instead, more sellers are entering the market. While I don't have any proof of this, I have to think the only reason inventory is increasing is because people have to sell rather than want to sell. Again -- that's pure conjecture. But if you have something you want to sell but don't need to sell and no one is interested in buying what you want to sell, you usually don't offer it for sale.
4.) Either buyers or sellers are unrealistic about selling prices right now. Simply put, inventory isn't moving. Yet no one seems to be adjusting their prices to levels that do move inventory. At some point, we're going to see either large price drops to move inventory or people taking their houses off the market or a combination of both.
5.) Finally, we're just starting to see the effects of tightening lending standards right now. Fewer buyers = less demand = lower prices.
Milk Prices to Increase
From the WSJ:
Stories like this highlight why only looking at core inflation is a ridicules way to analyze inflation. Food and energy are commodities that everybody consumes on a regular basis -- regular as in everyday day of their lives. These prices make a strong imprint on people's buying habits.
In addition, this shows what is happening underneath the food market as a result of the ethanol situation. The increased used of blended fuels has increased demand for corn. However, there has not been an increase in corn supply commensurate with demand. As a result, corn prices have increased. Here is a weekly corn futures chart. Notice the big jump in prices that started last last year and the price consolidation that has gone on for the last 4 months or so.
The US food system is partially based on corn. Cattle are fed corn; sweeteners used in a variety of products are corn based. In short, corn is the agricultural equivalent of oil or natural gas. And it's price is going up, which is already starting to ripple through the US economy.
The recent rise in milk prices is affecting everyone from small dairy companies like Oberweis to the nation's largest milk producers and food companies. On Friday, the Agriculture Department, which regulates the minimum milk prices received by farmers, set the price that processors will have to pay for drinkable milk in July at $20.91 per hundred pounds of milk, up 17% from the June price and up 84% from a year earlier.
In the past few months, several factors have reduced the supply of milk world-wide or raised its cost of production. The European Union is ending subsidies on dairy exports, and a drought in Australia has cut the supply of milk available to Asia. In the U.S., some dairy farmers are raising milk prices to offset the higher prices they pay for cattle feed as corn prices rise. Corn is a key feed ingredient.
As processors pass their higher costs on to consumers in the form of more-expensive cartons of milk at the grocery store, it will add to the strain on many family budgets already stretched by higher fuel and energy costs. In May, the average price of a gallon of whole milk in the U.S. was $3.26, up 6.2% from $3.07 a year earlier, according to the Labor Department.
Stories like this highlight why only looking at core inflation is a ridicules way to analyze inflation. Food and energy are commodities that everybody consumes on a regular basis -- regular as in everyday day of their lives. These prices make a strong imprint on people's buying habits.
In addition, this shows what is happening underneath the food market as a result of the ethanol situation. The increased used of blended fuels has increased demand for corn. However, there has not been an increase in corn supply commensurate with demand. As a result, corn prices have increased. Here is a weekly corn futures chart. Notice the big jump in prices that started last last year and the price consolidation that has gone on for the last 4 months or so.
The US food system is partially based on corn. Cattle are fed corn; sweeteners used in a variety of products are corn based. In short, corn is the agricultural equivalent of oil or natural gas. And it's price is going up, which is already starting to ripple through the US economy.
Illiquidity And the Market
From the WSJ:
The article also notes the use of leverage heightens the problems of the funds if the investments lose value.
These two paragraphs succinctly explain why hedge funds have risen in popularity during this market rally. Low interest rates have driven investors from traditional fixed-income based investments like money market and bond funds. Additionally, hedge funds have an allure of sophistication that makes them more attractive. Think of this as the "keeping up with the Jone's" in the investment world. Put those two factors together and you have a situation that is ripe for the increased use of hedge funds.
However, there are two problems here. The first is illiquidity.
As someone who trades fairly regularly, I take liquidity as a given -- as I think do most people. We all expect to be able to sell our assets quickly if we need to. However, not all markets are liquid for a variety of reasons. The Bear Stearns' funds assets were illiquid for two reasons.
1.) The size of the funds. Managers don't just sell $3 billion is assets in a minute. A trade that large takes a few days at least. In addition, a trade that large alerts the street there may be a problem with a particular asset or market area.
2.) The type of securities. From what I have read, the Bear Stearns fund invested in the more illiquid portions of CDOs. If this is an accurate read, the fund has the distinct problem of needing to sell a large quantity of illiquid, under-performing assets. This is a classic example of lack of diversification.
Finally, there is the issue of leverage. Some hedge funds borrow money to increase their returns. However, increased leverage works the same way in bullish and bearish markets. While I am personally content to let people and institutions do what they want to with their money (however stupidly), here we have a really big problem. 9 to 1 leverage amplifies gains and losses. With this fund we have a loss of 20%, amplified 9 to 1 because of the mammoth amount of leverage. It looks to me that the manager didn't even consider the possibility of a loss. And that's where the real problem lies. This funds lack of forethought hurt the whole market.
Investors with plenty of cash on hand, thanks to years of low interest rates, have flocked to illiquid investments in search of outsize returns, often with the help of borrowed money. Some market experts worry that investing in illiquid assets, despite their inherent risks, has become almost mainstream.
In 2006, U.S. institutions such as pension funds and endowments, had about $1 of every $10 invested in less easily traded assets -- such as hedge funds, real estate and private-equity funds -- up 27% from 2003, according to consulting firm Greenwich Associates.
The article also notes the use of leverage heightens the problems of the funds if the investments lose value.
These two paragraphs succinctly explain why hedge funds have risen in popularity during this market rally. Low interest rates have driven investors from traditional fixed-income based investments like money market and bond funds. Additionally, hedge funds have an allure of sophistication that makes them more attractive. Think of this as the "keeping up with the Jone's" in the investment world. Put those two factors together and you have a situation that is ripe for the increased use of hedge funds.
However, there are two problems here. The first is illiquidity.
The Bear Stearns funds, whose investors include wealthy individuals, other hedge funds and some of the firm's own executives, are part of a recent boom in investment vehicles specializing in illiquid assets, such as exotic securities, highways and timber lands.
Unlike stocks or bonds listed on an exchange, such assets can't be readily bought or sold. That makes it hard to establish an accurate price for them. Fund managers have broad discretion in attaching a value to these assets, and often don't reveal many details of their trades.
As someone who trades fairly regularly, I take liquidity as a given -- as I think do most people. We all expect to be able to sell our assets quickly if we need to. However, not all markets are liquid for a variety of reasons. The Bear Stearns' funds assets were illiquid for two reasons.
1.) The size of the funds. Managers don't just sell $3 billion is assets in a minute. A trade that large takes a few days at least. In addition, a trade that large alerts the street there may be a problem with a particular asset or market area.
2.) The type of securities. From what I have read, the Bear Stearns fund invested in the more illiquid portions of CDOs. If this is an accurate read, the fund has the distinct problem of needing to sell a large quantity of illiquid, under-performing assets. This is a classic example of lack of diversification.
Finally, there is the issue of leverage. Some hedge funds borrow money to increase their returns. However, increased leverage works the same way in bullish and bearish markets. While I am personally content to let people and institutions do what they want to with their money (however stupidly), here we have a really big problem. 9 to 1 leverage amplifies gains and losses. With this fund we have a loss of 20%, amplified 9 to 1 because of the mammoth amount of leverage. It looks to me that the manager didn't even consider the possibility of a loss. And that's where the real problem lies. This funds lack of forethought hurt the whole market.
Sunday, June 24, 2007
A Technical Look At the SPYs
This is a 5 year weekly chart. The indicator is the MACD. Notice a few things.
1.) In the last 5 years, the MACD has given 5 sell signals. 4 out of 5 of these times the index has corrected.
2.) The MACD looks like it is about to give a sell signal
1.) In the last 5 years, the MACD has given 5 sell signals. 4 out of 5 of these times the index has corrected.
2.) The MACD looks like it is about to give a sell signal
Random Thoughts on the SPYs
These observations are from my trading notebook. They are in no order of importance. Each observation is simply that -- an observation.
- Bad week. The market was down as a result of concerns over Bear Stearns hedge fund issues. There was also a lack of economic news.
- The SMAs are either neutral (the 10 and 20) or still positive (the 50 and 200).
- There is support at the 149 level above 1% below the current level.
- The market closed slightly below the 50 SMA on Friday.
- Volume was heavy on Friday and the market lost some ground. This indicates traders are nervous about the market because they don't want to keep positions over the weekend.
- The market may be forming a double top, or consolidating in a triangle formation.
- Short interest is at a record. This is considered a contrary indicator.
- OBV is neutral, and has been fluctuating between 4.25 billion and 4.75 billion since early May.
- CMF indicates money is leaving the market.
- Breadth charts from Stockcharts.com are neutral or negative
- Daily MACD has been declining since early May
- P&F is a high pole warning, but the underlying volume total for this is about 1/3 the size of the latest upswing volume total.
Short version -- There is strong technical and fundamental evidence the market is either consolidating or correcting. The volume indicators aren't showing a massive exodus from the market. If this were the case, the OBV vould be turning negative to confirm the CMF number. The volume figures are showing people taking profits off the table.
Subscribe to:
Posts (Atom)