Last month, China said it would require producers of pork, eggs and other farm goods to seek government permission before raising prices. When producers do seek permission, it is denied, market participants say. Thailand is taking similar steps on instant noodles and cooking oil, while Russia is trying to cap prices on certain types of bread, eggs and milk.
Elsewhere, Mexico is trying to control the price of tortillas, and Venezuela is capping prices on staples including milk and sugar. Malaysia is setting up a National Price Council to monitor food costs and is planning stockpiles of major foods, as well as a 24-hour hot line for consumers to vent about spiraling food costs.
These measures reflect the mounting pressure on developing economies as food costs rise sharply. Food-price inflation is running at an 11% annual rate in major developing countries, up from about 4.5% in 2006, according to Bank of America Corp. The price rises partly reflect increased demand from emerging markets and higher oil prices, which drive up the cost of growing and transporting food.
In Singapore, inflation accelerated to a 25-year high in December, partly because of food. In Mexico, Malaysia, Pakistan and Indonesia, food-price increases or shortages have triggered protests. Late last year, three Chinese shoppers were trampled to death in a supermarket scuffle over cooking oil. In poor Caribbean nations like Haiti, the situation is especially dire.
There is good and bad news to increased prosperity. The good news is everybody is making more money, which increases the standard of living. The bad news is increased standard's of living increases overall demand for food. Making that situation more difficult is the US' use of ethanol, which has really complicated the corn market -- and not for the better.
I have reprinted the following chart many times over the last year or so, and will continue to do so.
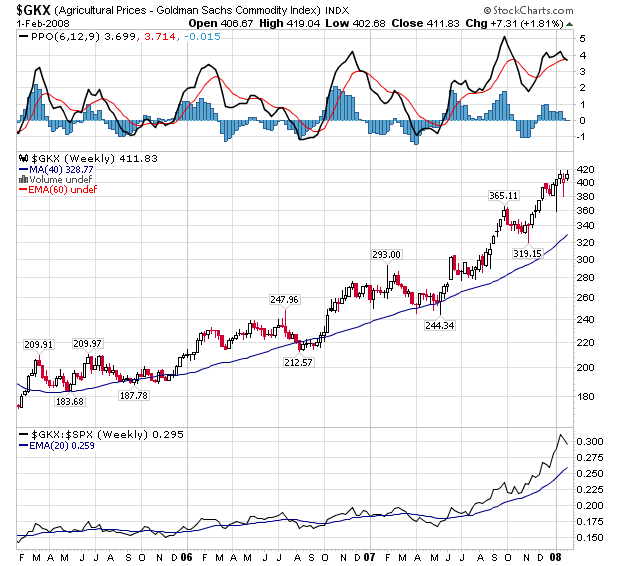
This is a chart of agricultural prices as represented by the Goldman Sachs commodity index. It shows a 133% increase over the last 3 years. In addition, the chart is a clear bull market chart with higher highs and higher lows.
A look at the various components of this chart shows the exact same pattern:
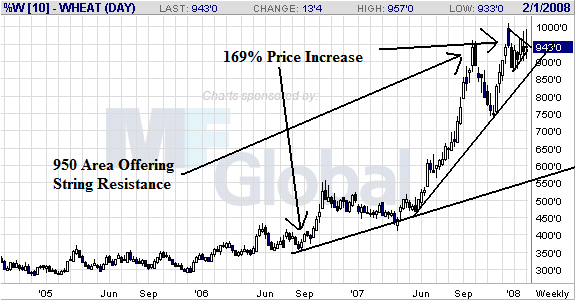
Wheat had a huge price spike last year, nearly doubling in price. While the 950 area is offering strong resistance right now, a move through that area would indicate a continuation of the market's bull run.
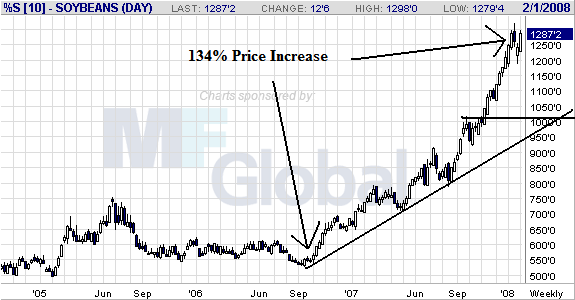
Soy has been in a bull run since late 2006, with a clear pattern of higher highs and higher lows.
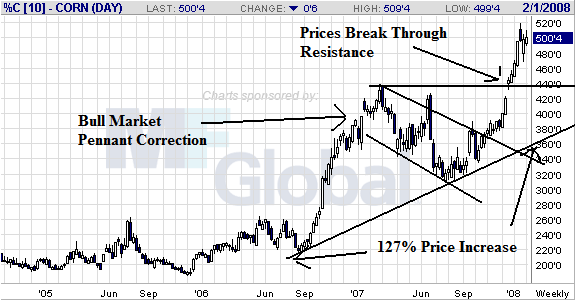
Corn is showing an strong rally as well, with prices doubling in the period of about a year and a half.
At some point, these price increases have to bleed into prices at the retail level. While governments are attempting to thwart the pain at the retail level, price controls will eventually push producers out of the market as their profits go away -- or encourage them to produce inefficiently, which is the last thing they need right now. The only way to deal with this problem is to increase supply in a big way.