Thankfully, stockcharts.com keeps a running total of these numbers for the NYSE and NASDAQ. Here are those charts.
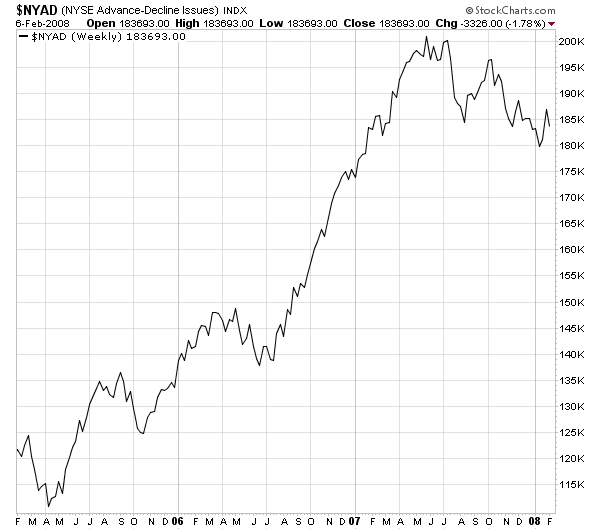
The NY advance/decline line is in a downward sloping range. It's been decreasing for about a 8 months now which is not a good development. It indicates the number of stocks declining in value is larger than then number of stocks increasing in value. Also note this number has climbed a lot over the last two years, so we have a long way to go down.
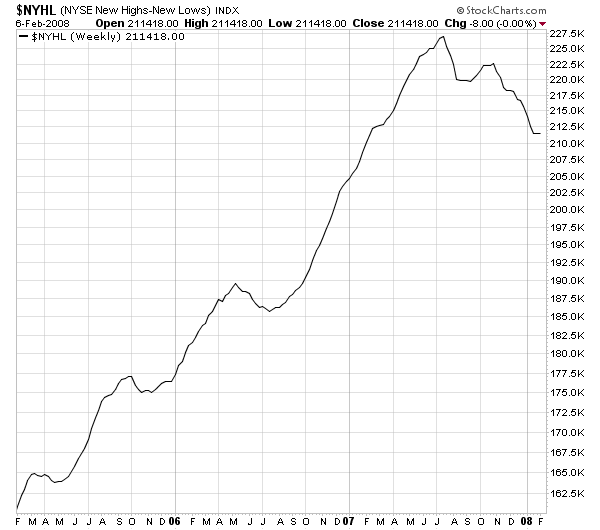
The NYSE new high/new low number has the exact same analysis as the NYSE advance/decline line.
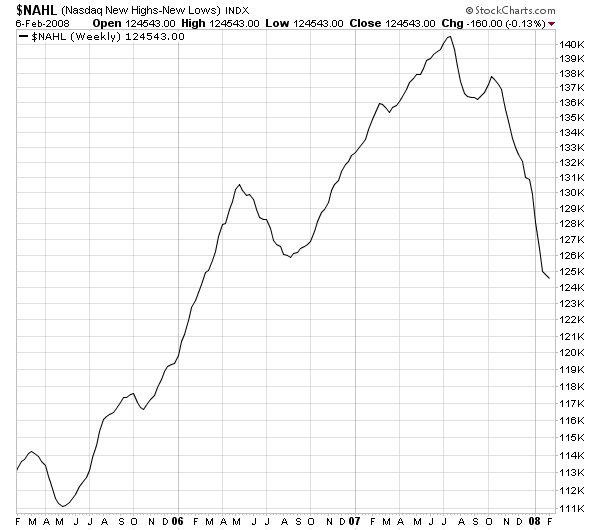
The NASDAQ new high/new low has been dropping hard since October, indicating there are some areas of the market that are taking very large hits.
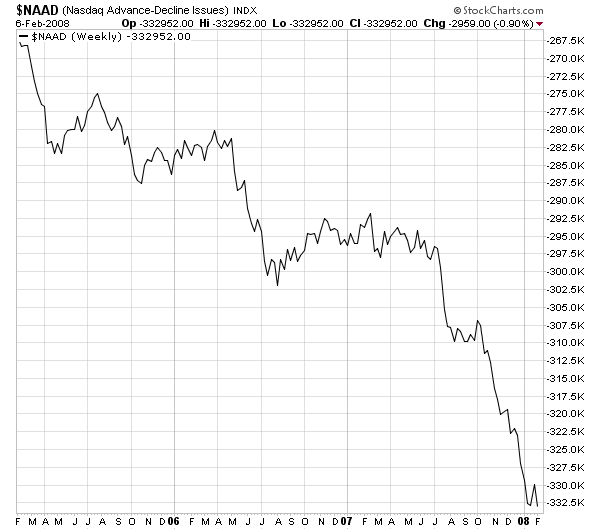
The NASDAQ advance/decline line has been a disaster for two years. I have to wonder if this index is still feeling the mathematical effects of the 1990s bubble (remember we saw some extreme distortions during that run). However, if not, this chart makes me wonder why anyone thought NASDAQ would be the markets saving grace.
The point of the above charts is this: the technical underpinnings of the market are deteriorating. In addition, it also means that fewer and fewer stocks are doing well.
Enter the IBD 100, which is a list of stocks picked by IBD's ratings system. In general, this list is a group of industry and market leading growth companies. IBD's method of picking stocks is pretty solid. In addition, a lot of people let IBD do the work for them, relying on this list as a pre-screened group of winners. So we should pay attention to what this group is doing.
From IBD:
Nowhere is there better evidence of a poor market than in the IBD 100. This list of the market's best names is chock-full of problems.
First off, for the most part we're seeing the same old names that led the market before this correction began.
With every new market uptrend, new leadership emerges. So far there's little in the way of new components with solid fundamentals and institutional sponsorship.
The next problem is related to the first: These "leaders" are much damaged. In many cases their corrections are deep, and many broke badly in high-volume sell-offs.
So, the IBD 100 isn't doing that well either.
Let's tie all of this together.
Market Breadth is deteriorating.
The stocks that were doing well -- the stocks that were propping up the deteriorating market conditions -- aren't doing well either.
Overall, this is not a good development for the market as a whole.