Enjoy your next steak, because prices from Shanghai to San Francisco are only going up.
The highest corn prices since at least the Civil War, based on Chicago Board of Trade data, mean U.S. feedlots are losing money on every animal they sell, discouraging production as rising global incomes increase meat consumption and a declining dollar spurs exports. Cattle may rise 13 percent by the end of the year on the Chicago Mercantile Exchange and Brazil's Bolsa de Mercadorias e Futuros, futures contracts show.
Not since 1996, when corn reached what was then a record $5 a bushel, have cattle been this cheap relative to their primary source of feed. Cattle are the seventh-worst performer of the 26-member UBS Bloomberg Constant Maturity Commodity Index in the past year, a time when soybeans, oil and copper jumped to records. After adjusting for inflation, cattle are down 27 percent from their 1988 peak.
``It's pretty certain that we'll see a decline in domestic supply in the U.S.,'' Joesley Batista, chief executive officer of JBS SA, the world's biggest beef producer, told reporters in Sao Paulo on May 15. ``As a result, we'll have price hikes and improved margins.''
Agricultural/food price inflation has been a hot topic over the last few months. I've been concerned about the long-term spike in prices for about 6-9 months. This is just another symptom of the underlying problem: as the world's standard of loving increases (think India and China making more and more money) people will want better things like steak.
So, let's take a look at a few charts.

On the monthly corn chart, simply notice the huge price spike that's occurred.
On the weekly chart, notice the following:
-- Prices rallied from the summer of 2006 to the beginning of 2007
-- Prices consolidated gains until the fourth quarter of 2007
-- Prices have been rallying strongly since the fourth quarter of 2007
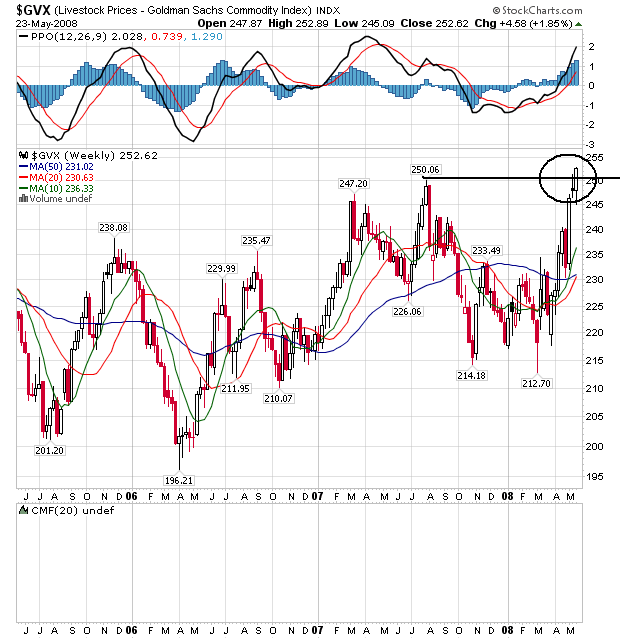
On the weekly livestock chart, notice that prices have been meandering for the better part of two years. But also note that prices have recently moved through a key area of resistance.

On the daily chart, notice that prices have been rallying since the beginning of March, with prices continually moving through key resistance levels. Also note that the shorter SMAs are higher than the longer SMAs, that all the SMAs are moving higher and that prices are higher than the SMAs. This is a bullish chart.