.....The auto industry is the nation's largest manufacturing sector, accounting for almost 4% of U.S. gross domestic product. It employs about 2.5 million people directly or indirectly, and spends tens of billions of dollars a year in research and development.
.....
Through most of the 1990s, auto makers sold a little over 15 million cars and light trucks a year in the U.S. market. That changed in the late 1990s: With gasoline prices low and many U.S. consumers feeling flush from the tech-stock boom, auto sales surged. Sales peaked at 17.4 million in 2000 and remained near 17 million for another five years. Heads of General Motors Corp. and Toyota said the U.S. was entering a golden age of the automobile. In 2003, Toyota's head of North American sales predicted the industry would soon be selling 20 million vehicles a year.
They were wrong. Sales started falling in 2006 and this year are expected to be right back where they were in the 1990s, at just over 15 million. Last week, market researcher Global Insight Inc. lowered its 2008 forecast for U.S. vehicle sales to below 15 million. Global Insight now believes sales won't reach previous highs again until 2012, a year later than it had previously thought.
"Going forward, 16 million is a good year," says Ron Harbour, whose firm, Harbour Consulting, tracks auto production.
Imagine that -- cheap and/or easy financing terms were used to inflate the market. Where have I heard that before?
As a side note, Mrs. Bonddad and I have been talking about getting a new car. We are both amazed that gas mileage technology has not significantly improved over the last 15 years. In fact, I would swear it has gotten generally worse (but I can't prove that).
Let's take a look at the charts, which we can break down into US and Japanese auto makers.
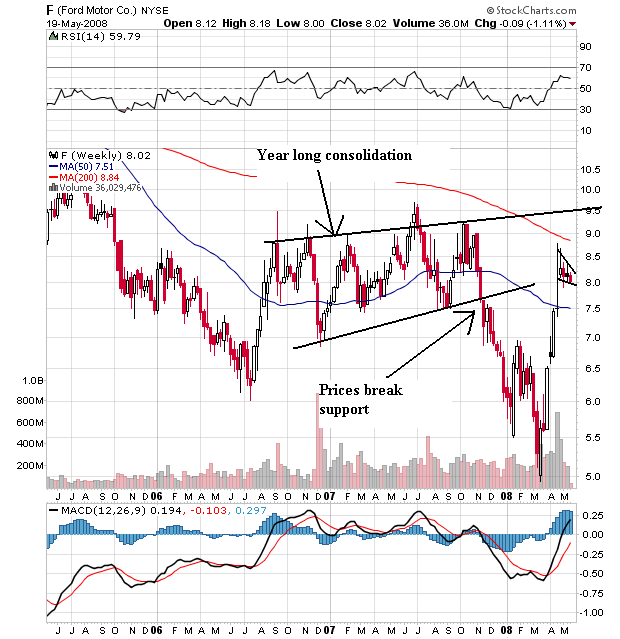
The main issue with Ford is we saw prices consolidated from the end of 2007 to the end of 2008 when they broke through support. They have since rebounded and have formed a pennant pattern over the last few weeks. But note that prices are back to where they were in 2007-2008, and not higher.
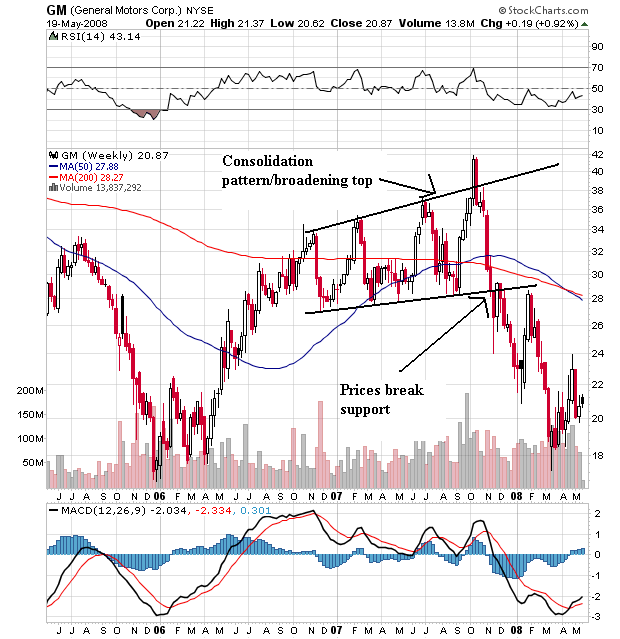
On General Motors, notice that prices consolidated in a broadening pattern over the same period as Ford. However, GM has yet to significantly bounce back from the last summer sell-off.
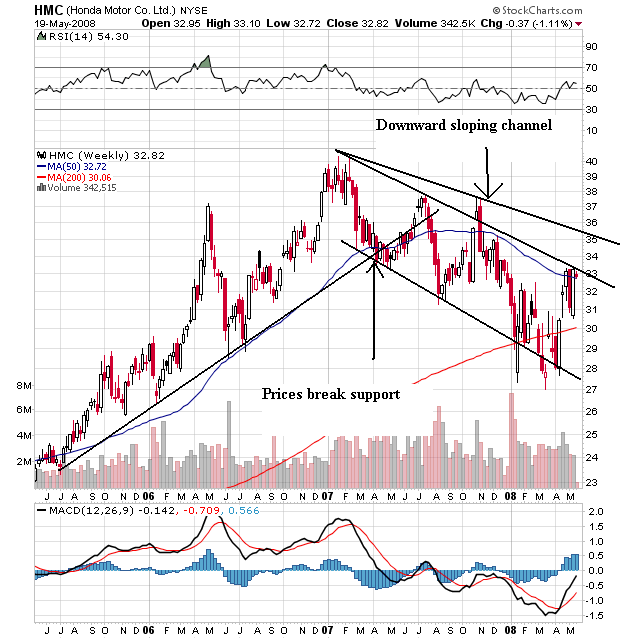
On Honda's chart, notice the strong rally from 23 to 39 that lasted from 2006 to the end of 20006. Also note that prices have dropped in a downward sloping channel (which has two possible top channel lines), but in a very orderly way. Bottom line, trades still see Honda as having value.
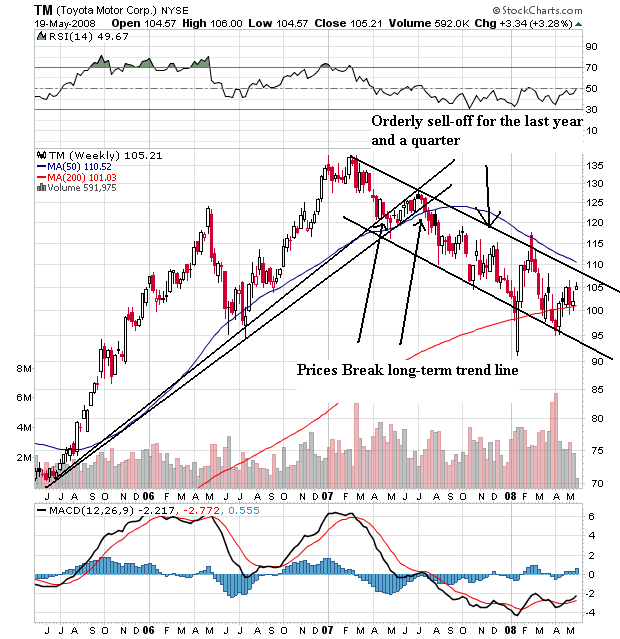
Toyota has a chart similar to Honda's. There is a good strong rally from about 70 - 135 between 2005 and the end of 2006 followed by an orderly sell-off. My guess is the Prius sales were a prime reason for this (the Prius has continually been a top seller in a big way). Whatever the reason, this is a good chart regardless of the sell-off.
So -- what do these charts tell us? Simple -- the Japanese car companies have a far better business model than US car companies. Seems like old times.