Now, onto the markets. Let's see how all of the charts look after a week away.
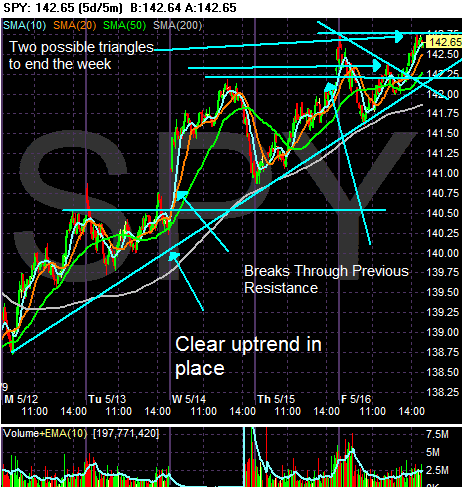
The SPYs were in a clear rally last week, gaining about 2.8% from low to high. The uptrend started from a low point early Monday morning an continued higher throughout the week. Notice the market continually broke through resistance levels. Also note the possible two consolidation triangles that formed at the end of the week.
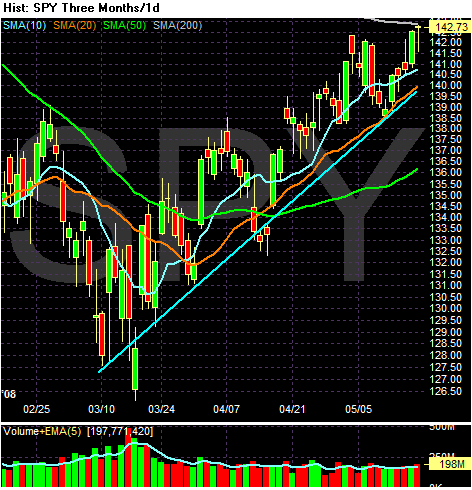
On the daily chart, notice the following:
-- The 10, 20 and 50 day SMA are all moving higher
-- The shorter SMAs are higher than the longer SMAs
-- Prices are above the SMAs
-- There is a clear uptrend in place
-- Prices are right below the 200 day SMA (the gray line right above Friday's close). Prices need to move through this level.
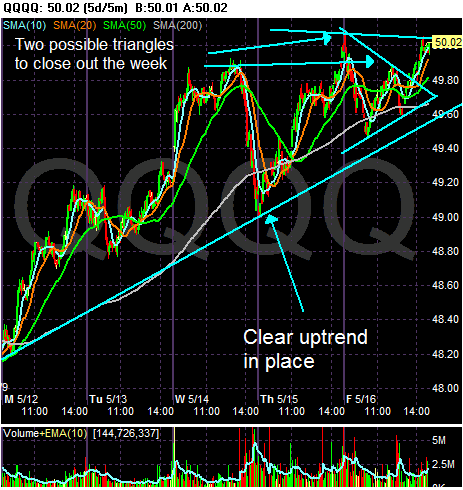
The QQQQs also had a strong rally last week, moving up 3.77% on the week. Notice the clear uptrend in place last week, along with two possible triangle consolidations that occurred at the end of the week.
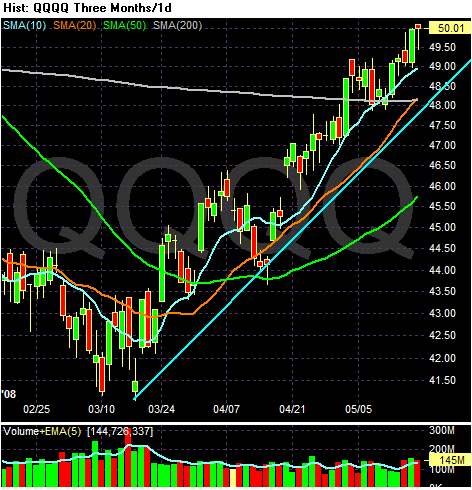
On the daily chart of the QQQQs, notice the following:
-- Prices are above all the SMAs (even the 200)
-- The 10 day SMA has crossed the 200 day SMA and the 20 day SMA is about to cross the 200 day SMA
-- The shorter SMAs are all moving higher
-- The shorter SMAs are above the longer SMAs (the 10 > 20 > 50).
-- There is a clear trend in place.
-- Notice the uptick in volume the last three days of last week.
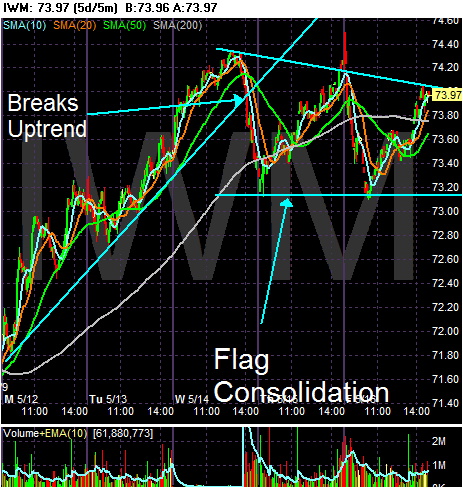
On the IWMs chart from last week, notice they broke an upward trend late Wednesday and have since been trading in a pennant formation. Basically, the IWMs are consolidating gains right now.
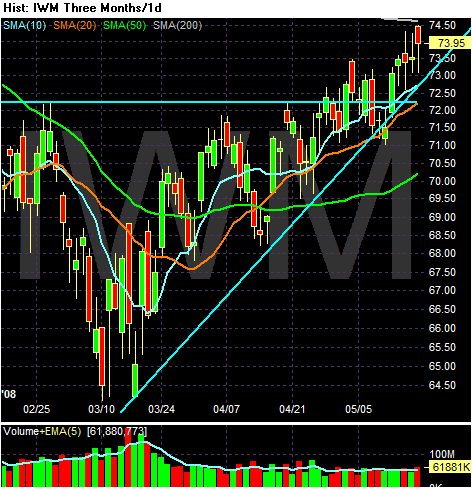
On the daily chart for the IWMs, note the following:
-- All the shorter SMAs (10, 20, and 50 SMA) are moving higher.
-- The shorter SMAs are above the longer SMAs (10 > 20 > 50).
-- Prices are above the shorter SMAs
-- Prices are just below the 200 day SMA
-- There is a definite uptrend in place
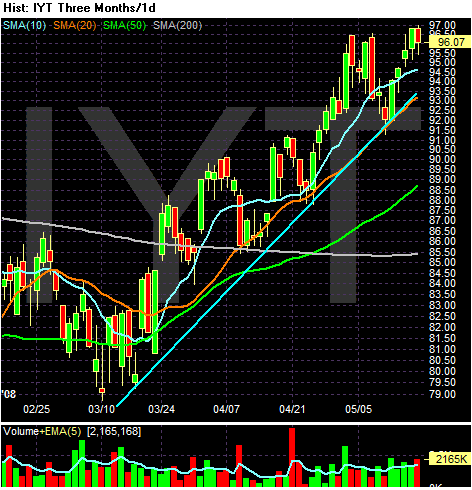
On the transports, notice the following:
-- Prices are above all the SMAs -- including the 200
-- The shorter SMAs are above all the SMAs
-- The 10, 20 and 50 SMA are all moving higher
-- The 200 day SMA is leveling out
-- The shorter SMAs are above the 200 day SMA
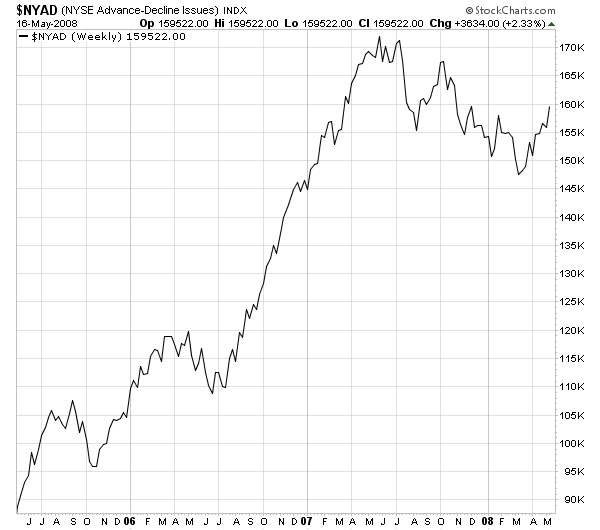
On the NY advance/decline line, notice the line has been advancing solidly with this rally.
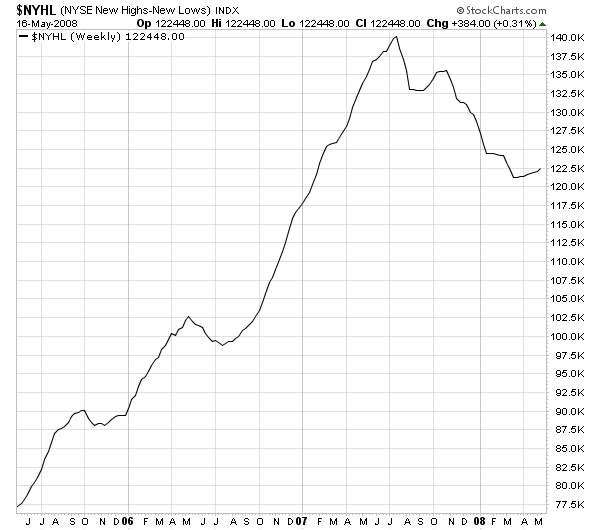
However, the high low number is still lagging a bit. Afraid to Trade argues this is because of the strength of the sell-off starting at the end of last summer. While this may be, this is still a troubling development.
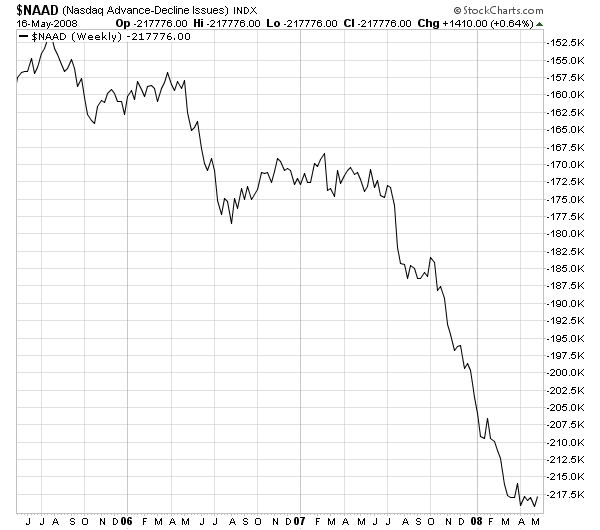
This is a big problem: the NASDAQ advance decline line isn't moving higher at all. That indicates this rally isn't that strong and is in danger of a reversal.
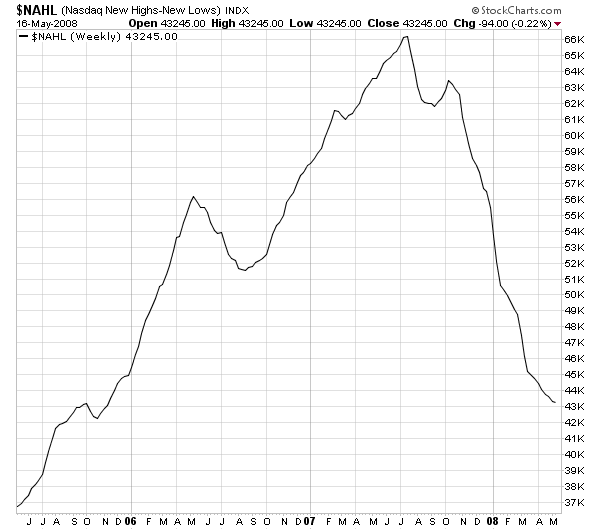
Also note the NASDAQ new high/new low chart is dropping as well.
While the NASDAQ is leading the market higher, the advance/decline line and the dropping new high/new low line are deeply troubling. Both of those averages should be moving higher, especially on the average that is leading the market.