David Ader, a U.S. government bond strategist at RBS Greenwich Capital, said many cross-currents buffeted bonds this week, not the least of which was "a steady litany of hawkish Fedspeak" from Fed officials, speculation about a shift in Libor, a "V-shaped" economic recovery, and weak economic data.
Hawkish tones from the Fed implies rates are going up. This would be a sell signal to Treasury traders for several reasons. First, it probably means inflation is increasing which erodes the value of fixed income investments. Secondly it means bonds that will be issued in the future will have a higher coupon and will therefore be more valuable than the current run.
However, weak economic data indicates the Fed won't be raising rates and may very well be lowering rates. That would make current issue Treasuries more valuable leading to higher prices and lower yields.
The basic problem is the traders are getting mixed signals on a variety of fronts.
Last week Fed officials made several speeches highlighting their concern over inflation:
The myriad Fed officials who offered their views Tuesday — including Cleveland President Sandra Pianalto, San Francisco President Janet Yellen, Kansas City President Thomas Hoenig and Dallas President Richard Fisher — all paid heed to the risk of stoking inflation by keeping interest rates low for too long.
But there was also very weak economic news.
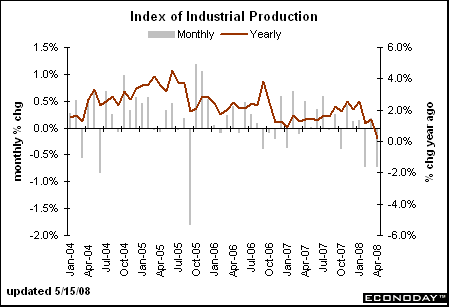
Year-over-year industrial production is dropping
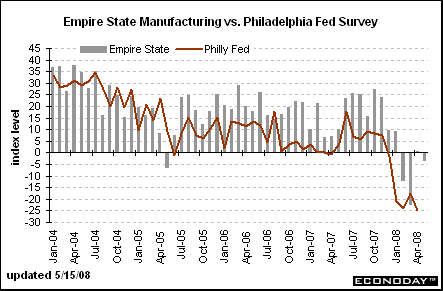
Year-over-year empire state is still negative, and
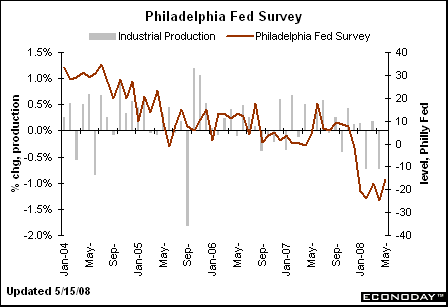
The Philly Fed is still deeply negative.
In addition, a trend may be developing: investors are selling treasuries to move into stocks and higher yielding assets:
Treasuries fell Wednesday, as a benign inflation report seemed to lessen the chance of a Federal Reserve interest rate hike this year and encouraged investors to buy stocks and higher-yielding fixed-income securities instead of safe-haven government debt.
However, the Treasury market is now running into resistance:
It is anyone's guess where U.S. Treasury yields will go from here, and this week is unlikely to bring any clues.
Bonds have been on a weakening trend since Bear Stearns Cos.' mid-March downfall. Believing they have seen the worst of the credit crisis, investors have relaxed their dependence on risk-free government paper. This action has brought Treasury yields, which move inversely to prices, to highs last seen in January.
But now those yields are bumping against stubborn resistance -- 2.5% for the two-year note and 3.90% for the 10-year note -- and it will take more compelling evidence of either economic or financial-market recovery to push prices lower and yields higher.
Federal Reserve officials can't produce that kind of evidence at the moment; last week's cacophony of speakers appears to have left markets no more assured of the economic or monetary-policy outlook than before.
Let's look at the charts to see what's happening there.
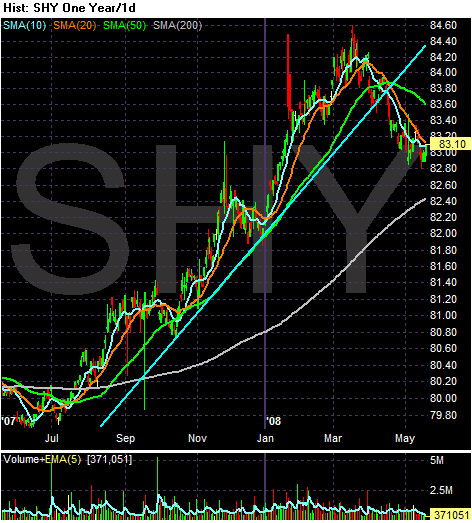
On the daily SHY chart (1-3 year Treasury) the most important thing to note is the clear upward trend break that happened in mid-March. Before that this part of the Treasury market benefited from the "flight to safety" as investors wanted their money returned. As the credit markets unfroze a bit this trend lessened and traders left the safety of the front end of the yield curve.
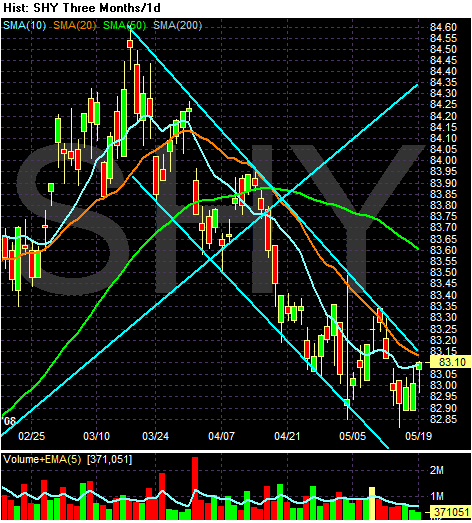
On the 3-month chart, notice the clear downward sloping trend of the last few months action. Also notice the following:
-- Prices are above the 200 day SMA
-- The shorter SMAs are below the longer SMAs
-- All the shorter SMAs are heading lower
-- Prices have been bouncing off of the 10 and 20 day SMA for the last month or so
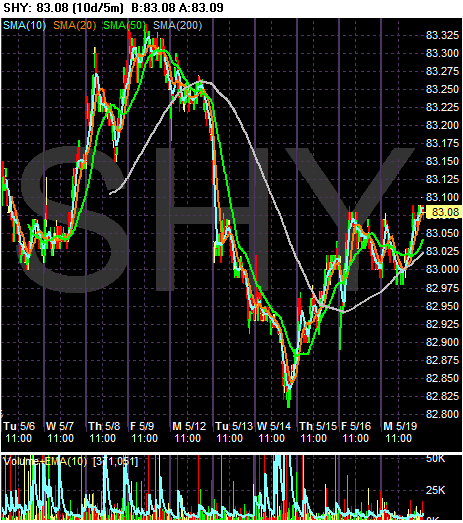
But in the last 10 days, notice the market has been whipsawed and is about where it started. This chart shows the conflicting nature of the trends in the Treasury market right now.
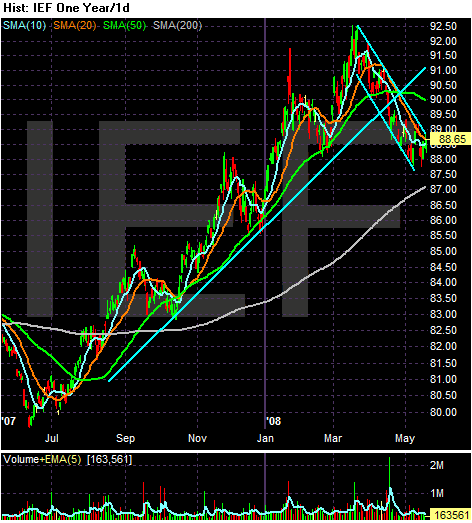
On the IEF, notice (again) a clear trend break from the "flight to safety" trade.
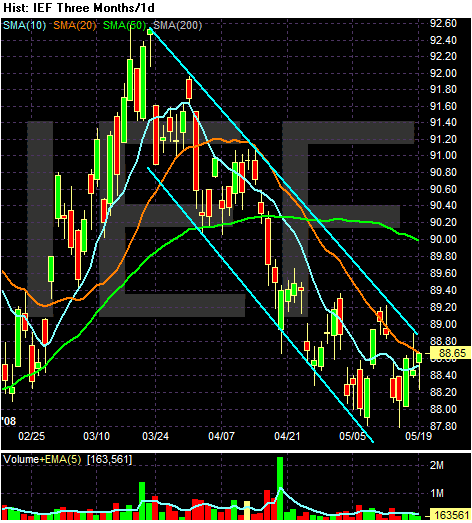
And on the 3 months daily chart, notice the clear downward sloping trend. This is an orderly sell-off. Also note the following:
-- The shorter SMAs are below the longer SMAs
-- The 10 day SMA is leveling out. It may cross the 20 SMA within the next week.
-- Prices have been bouncing off the 10 and 20 day SMA for the last month or so
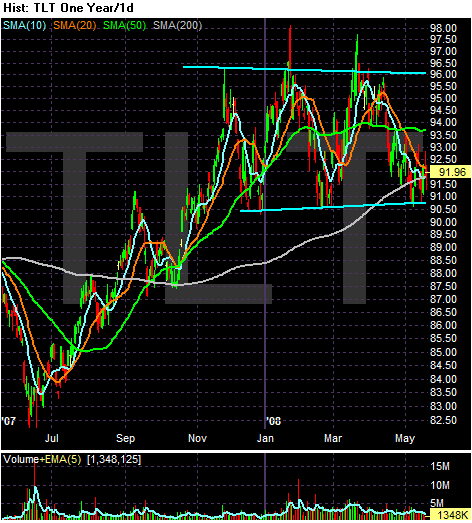
On the long-end of the curve we're in a trading range and have been since the end of last year.