I'm going to pull back on the charts and show a 3-month chart to give you an idea of where prices are in the bigger picture.
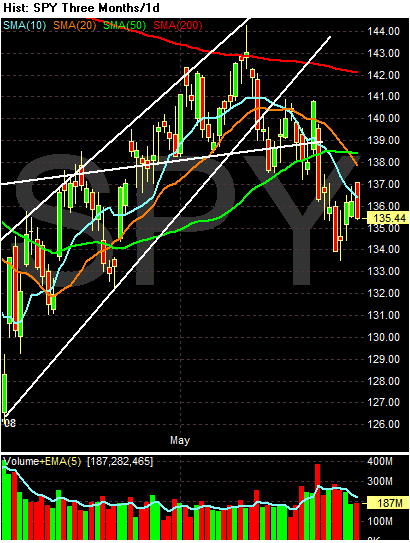
In mid-May, prices hit the 200 day SMA and have since retreated. Since the index hit that level:
-- The 10 and 20 day SMA have moved lower
-- The 10 and 20 day SMA crossed below the 50 day SMA
-- Prices are below all the SMAs
-- The 50 day SMA has moved into a horizontal position.
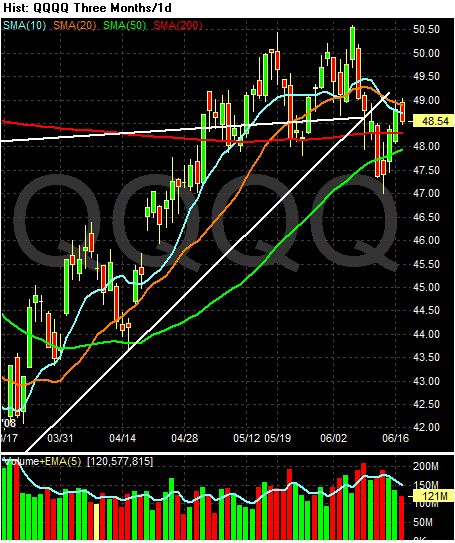
The QQQQs formed a double top in May and June. Since prices have retreated from those levels, notice the following:
-- Prices dropped to the 50 day SMA, but have risen above the 200 day SMA since then.
-- The 10 day SMA has crossed below the 20 day SMA
-- The 10 and 20 day SMA have both moved lower
-- Today prices bounced off the 20 day SMA
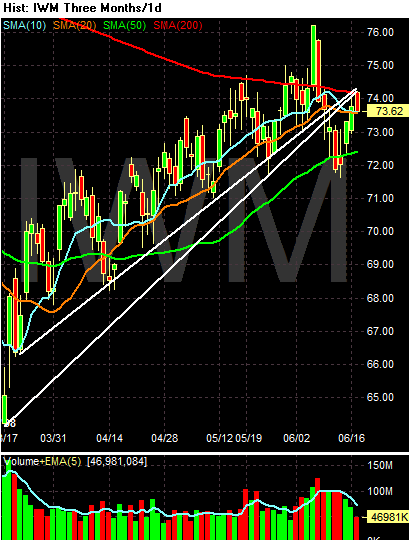
The IWMS broke above the 200 day SMA, but have since fallen below that level. A quick retreat below a strategically important line is not a good development.