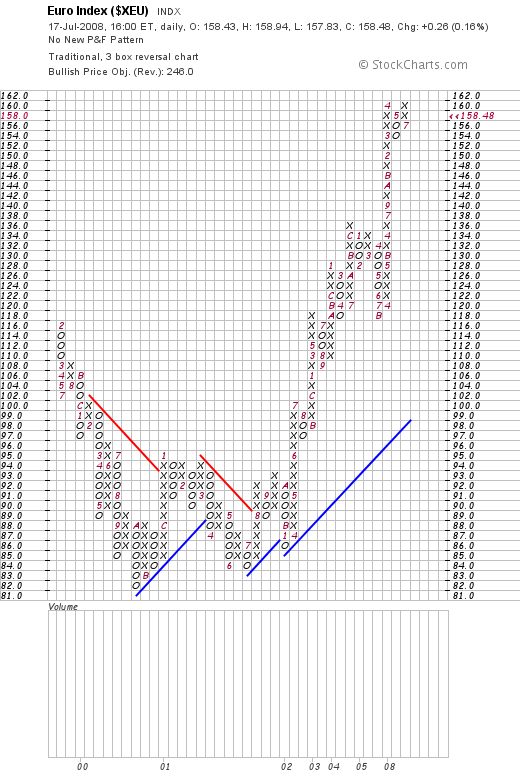
On the P&F chart, notice the euro has been in a very strong rally since 2002. Also note the especially strong run in 2008. However, note the possible double top forming as well. Bottom line: this chart says bull with a possible caution of a double top forming.
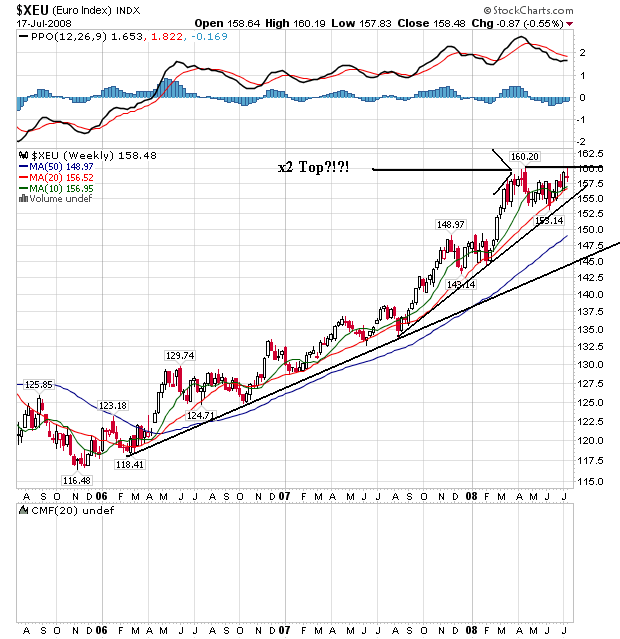
The euro's weekly chart has the euro in a strong rally from the end of 2006. The currency has continually moved through resistance and then consolidated those gains. However, note (again) the possible formation of a double top. But also note the bullish configuration of the SMAs -- the shorter SMAs are above the longer SMAs, all the SMAs are moving higher and prices are above all the SMAs.
I mention the possible double top because currency traders have continually referred to the 160 level as an area of key resistance for the euro.
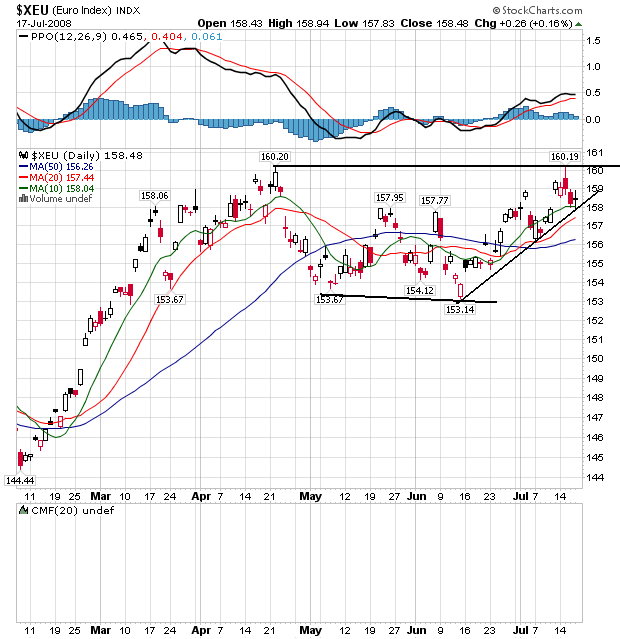
The daily chart shows the clear issue the euro has with the 160 level. Prices hit this level in mid-April and then retreated. They meandered sideways a bit and are now making another run at the 160 level. On the bullish side, prices are above the SMAs, and the shorter SMAs are above the longer SMAs. The 10 day SMA is moving sideways, although that could change fairly quickly. The bottom line is this is a chart that is either getting ready to move above key upadie resistance or it will back down. Only time will tell which one it is.