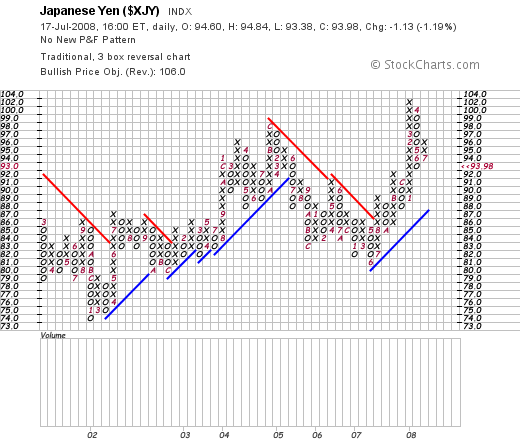
First, let's look at the P&F chart. This will give us an idea of the "absolute moves" of the yen. Notice that from 2004 until the beginning of 2007 there was a general downward sloping trend to the chart as prices made a series of lower peaks and lower lows. This is indicative of a bearish slump in the overall value. Then note that at the beginning 2007 the trend reversed, although the last two columns of the chart indicate some selling activity.
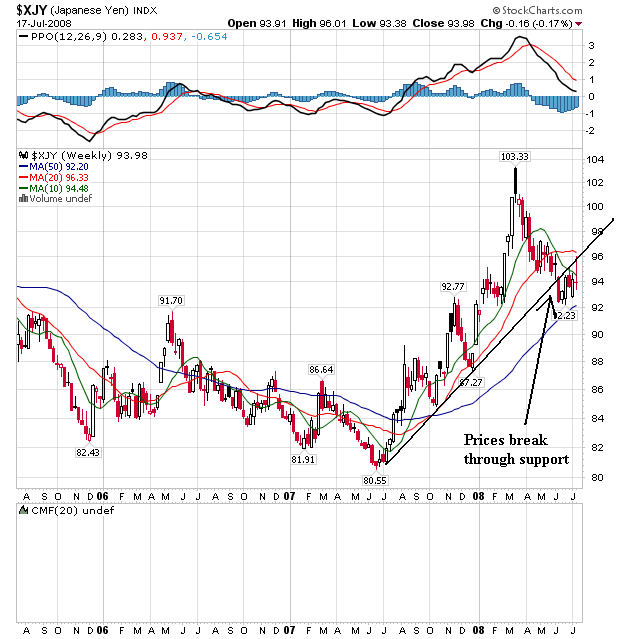
On the weekly chart, notice that since mid 2007 prices have risen sharply, continually breaking through resistance and then consolidating gains in a downward sloping flag pattern. However, prices broke below this upward sloping trendline in June of this year and are now using this trendline (along with the 10 week moving average) as resistance.
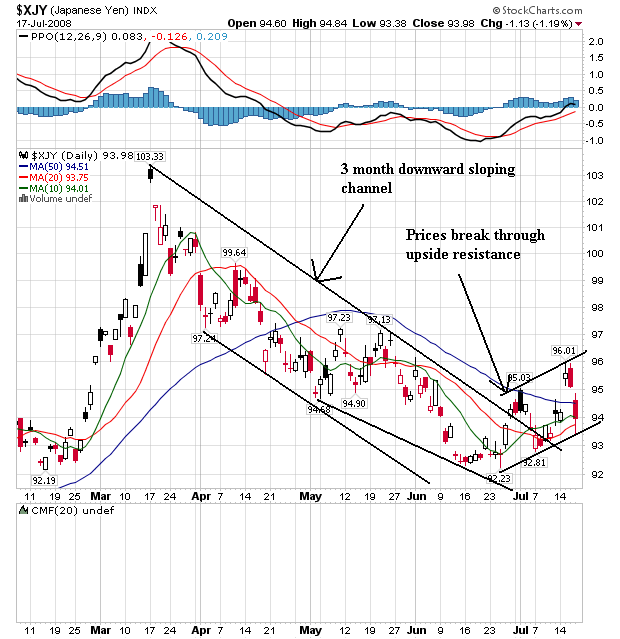
On the daily chart of the yen notice the following:
-- Prices were in a downward sloping trading range from late March until early July.
-- The 10 and the 20 day SMA are both moving higher
-- The 10 day SMA has crossed over the 20 day SMA
-- The 10 and 20 day SMA are below the 50 day SMA
-- The 50 day SMA has leveled out
This chart is in transition. The March - July correction is over, but the price/SMA picture is still cloudy. The short term SMAs are heading higher, but they are still below the longer SMAs. In addition, prices have broken above the 50 day SMA but have retreated from those levels.