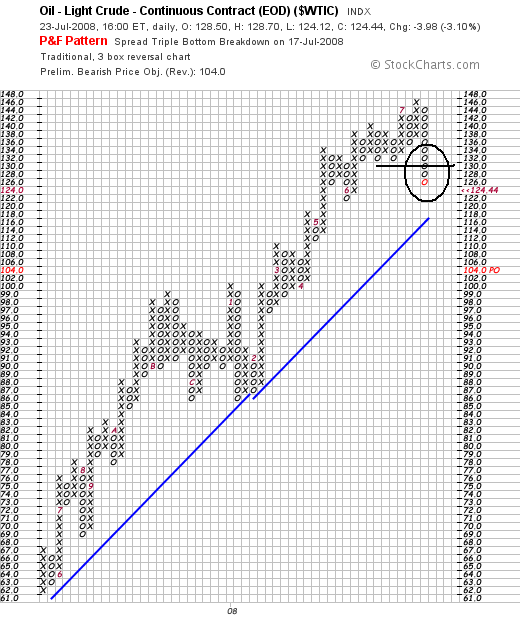
One of the biggest advantages of P&F charts is they clearly show important price levels. On the above chart, notice that 132 was a very important support level and that prices moved through that price this week.
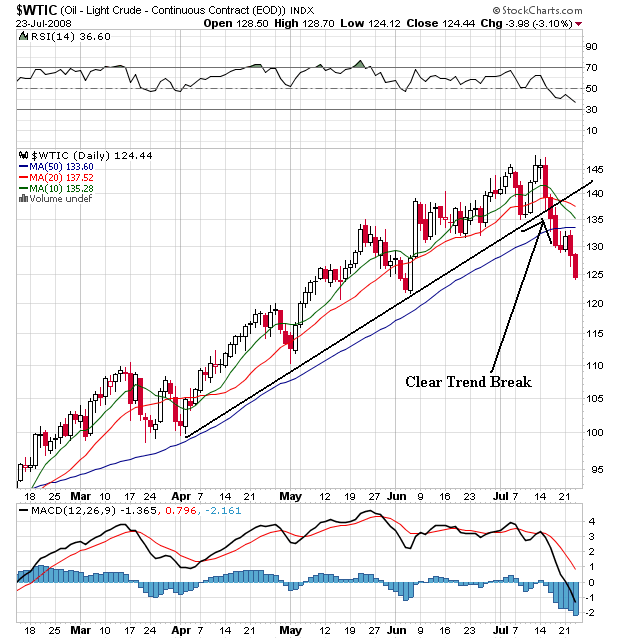
On the daily chart, notice the following:
-- Prices are below all the SMAs
-- The 10 and 20 day SMAs are both heading lower
-- The 10 day SMA has crossed below the 20 day SMA
-- Prices have broken the trend line that started in early April
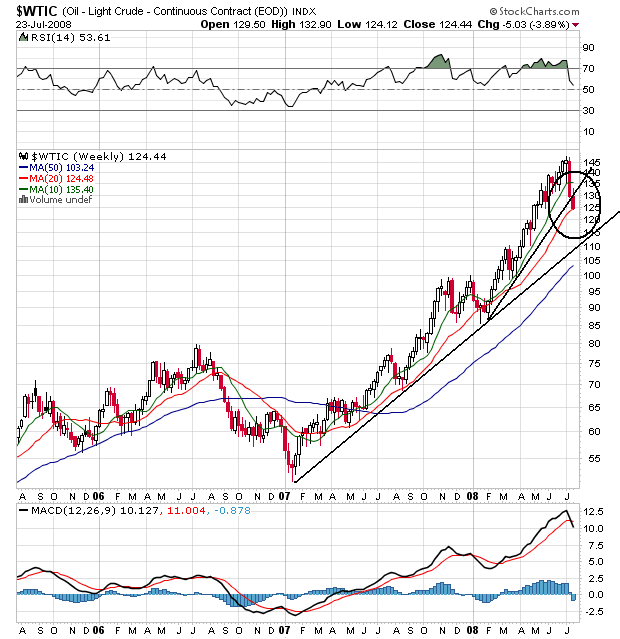
And finally we have the weekly chart. While the long-term upward trend line started in early 2007 is still firmly in place, the rally that started at the beginning of this year has clearly been broken. Prices are resting on the 20 week SMA and the MACD is overbought. This is a chart that is clearly correcting.