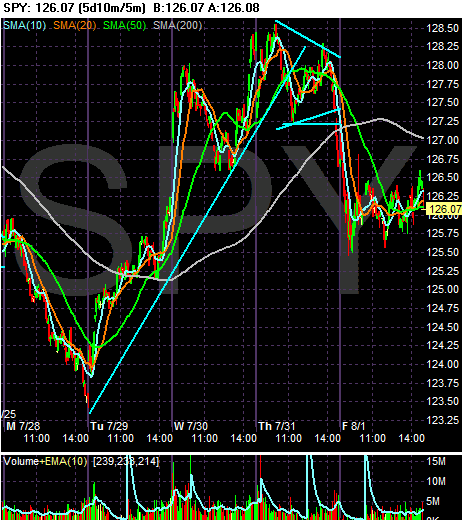
The SPYs had a down/up set of days on Monday and Tuesday, with Tuesday essentially wiping out the losses of Monday. Tuesday also market the beginning of a two and a half day rally that sent the market higher by 4%. The market formed a triangle consolidation on Thursday and then fell at the beginning of the day on Friday before moving sideways for the remainder of the day.
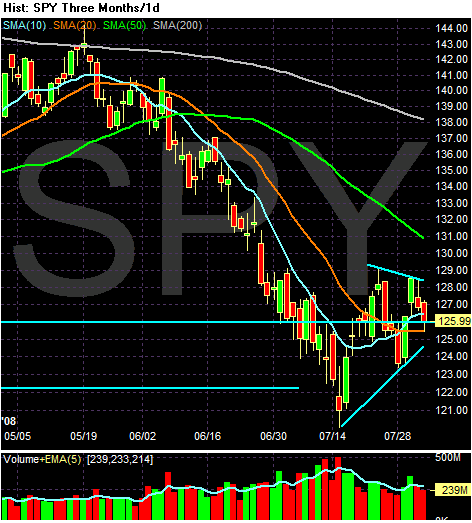
On the daily chart, notice the following:
-- Prices are forming a triangle consolidation pattern right now.
-- The 10 and 20 day SMA are both moving sideways.
-- The 10 day SMA is over the 20 day SMA, but just barely.
-- Prices and the short-term SMAs are tightly bunched, indicating a lack of direction.
-- The 50 and 200 day SMA are both heading lower
This chart is short-term neutral because of the tight arrangement of prices and the SMAs and the neutral position of the SMAs and prices. However, the long-term position is negative with the 50 and 200 day SMA heading lower.