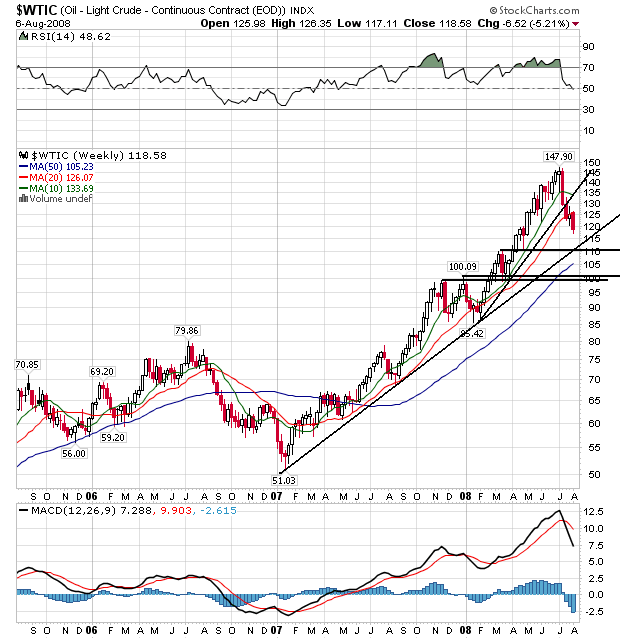
On the weekly chart, notice the following:
-- The primary trend that started at the beginning of 2007 is still in place. Oil will have to drop below $115/bbl for that trend to break. In other words, the primary trend is still in place.
-- Prices have dropped below the 10 and 20 week SMA
-- The 10 and 20 week SMAs are turning neutral.
-- Prices have printed some incredibly strong downward bars over the last few weeks.
-- There is strong technical support in the %110 and $100 area. This support comes not only from previous price points, but the fact these are solid round numbers.
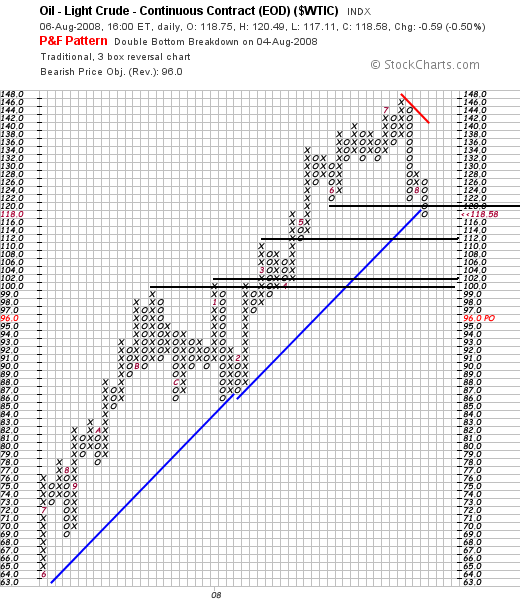
The P&F chart shows some other interesting developments.
-- The break of long-term P&F support
-- There is plenty of support at the $100/$102 level and some support in the $110/$112 area
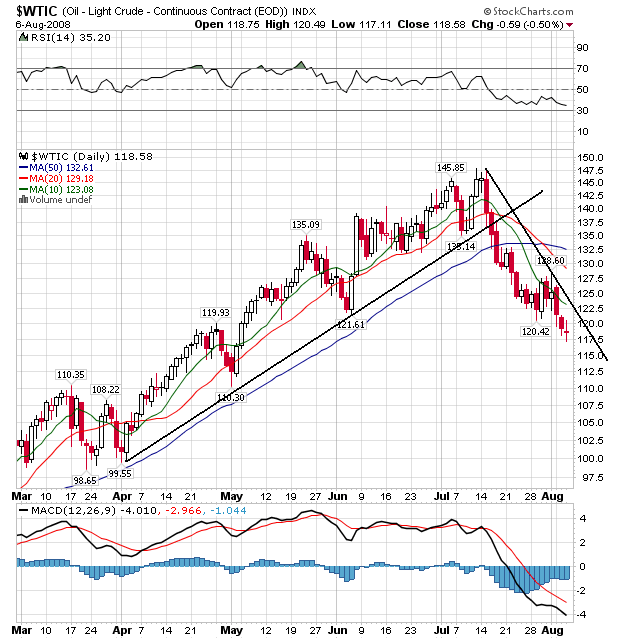
On the daily chart, notice the following:
-- Prices are below all the SMAs
-- The 10 and 20 day SMA have moved below the 50 day SMA
-- All the SMAs -- including the 50 day SMA -- are now moving lower
-- Prices moved into the 10 day SMA and bounced back. In other words, the 10 day SMA is now resistance rather than support