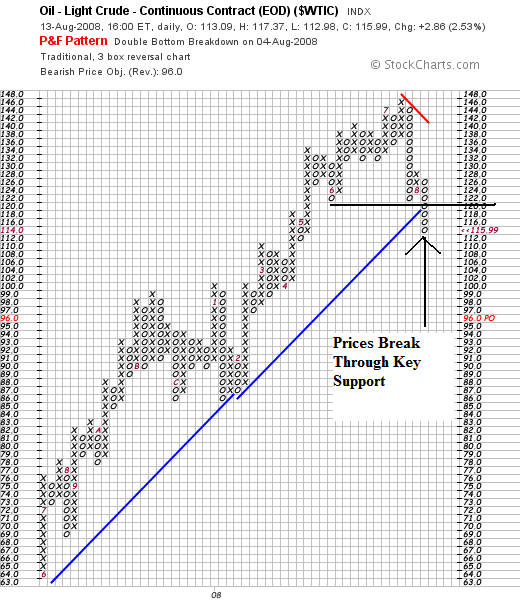
The P&F chart is very revealing. Looking carefully at the rally that led to the recent top in oil prices we see a clear pattern of rising bottoms and tops. Prices continually broke through key levels of upside resistance and then moved lower, consolidating gains.
Now look at the the last three columns. Notice we may be in a period where the market makes lower lows and lower highs -- a bear market pattern. Now, this is still very early in the correction so making bold predictions is pointless. However, it's also important to be aware what the chart may be saying in order to keep an eye out in future price movements.
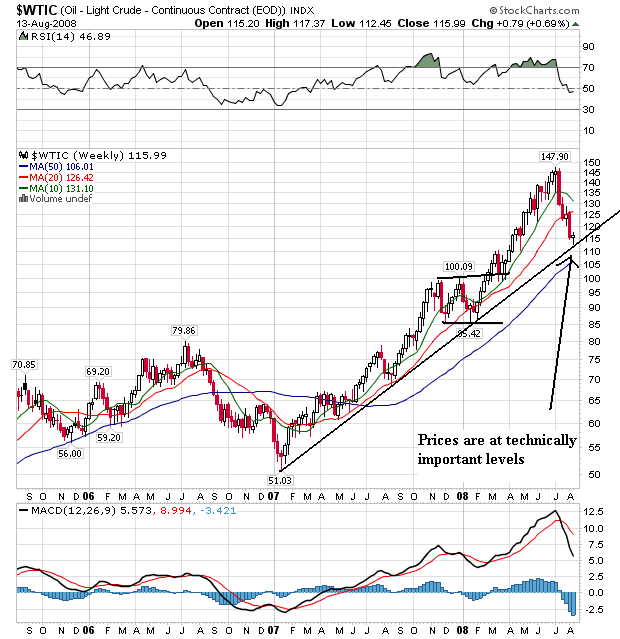
On the weekly chart, notice the following technical developments:
-- Prices have moved through the 10 and 20 week SMA
-- The 10 week SMA has turned negative. Because this is a weekly number it takes longer for trends to develop. Therefore, this number turning negative is a significant development
-- Prices are at a technically important level, bumping into the upward sloping trend line that started a year and a half ago
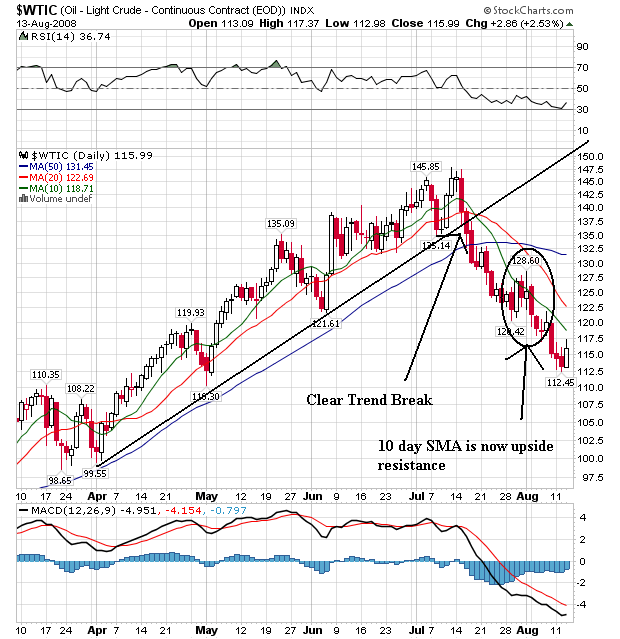
On the daily chart, notice the following:
-- Prices are below all the SMAs
-- All the SMAs are headed lower
-- The 10 and 20 day SMA have moved through the 50 week SMA
-- The 10 week SMA has provided upside resistance in the latest market sell-off.
The real question now is what is happening -- why are prices dropping like they are? It seems like a few weeks ago we were looking at record oil prices (and it was just a few weeks ago).
There are several reasons for the drop. The first is the realization that high prices are taking a bite out of demand. Note the following developments that have lowered demand:
"It looks like the high price has done its job in destroying demand," said Muhammad-Ali Zainy, senior energy economist at the Center for Global Energy Studies in London.
China reported Monday that its crude imports swooned 7% in July to a seven-month low. The Chinese government joined several other Asian nations in June, gently loosening federal subsidies to refiners and raising caps on retail gasoline prices.
Also consider this news from the US (hat tip: Calculated Risk):
Americans drove 4.7 percent less, or 12.2 billion miles fewer, in June 2008 than June 2007. The decline is most evident in rural travel, which has fallen by 4 percent – compared to the 1.2 percent decline in urban miles traveled – since the trend began last November.
Also consider this overall drop in US demand:
U.S. consumption fell by 800,000 barrels a day in the first half of '08 vs. the prior year, the largest drop in 26 years, the Energy Information Administration said Tuesday.
In addition, there has been an increase in overall supply:
The International Energy Agency said Tuesday that production rose nearly 900,000 barrels a day in July, bringing supply and demand, for the time being, into what appears to be a balance.
However, let's not forget the big picture (hat tip, the Big Picture):
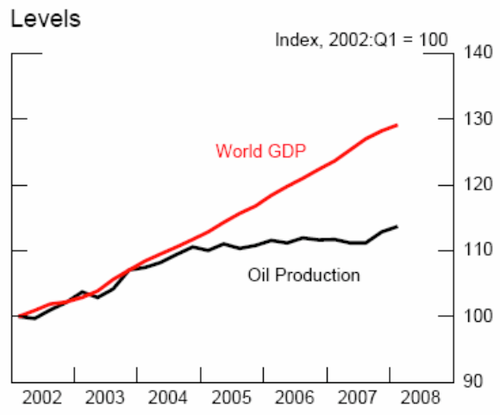
In other words, the overall supply/demand situation is still very much out of whack and will be for some time.