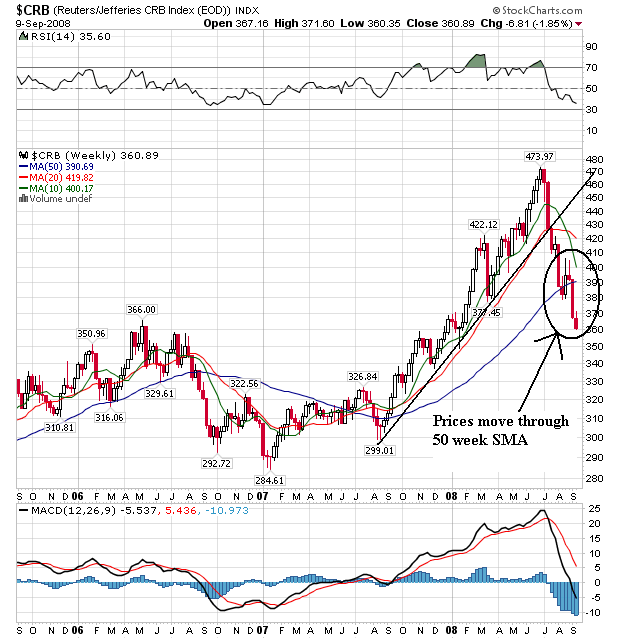
On the weekly chart, notice the following:
-- Price clearly broke the year long uptrend a few weeks ago
-- Prices have moved through the 50 week SMA and are heading lower. This is a very important technical development indicating downward moves are continuing.
-- Prices are below all the SMAs
-- The 10 week SMA has moved through the 20 week SMA
-- The 20 week SMA has turned negative
This chart is turning more and more bearish
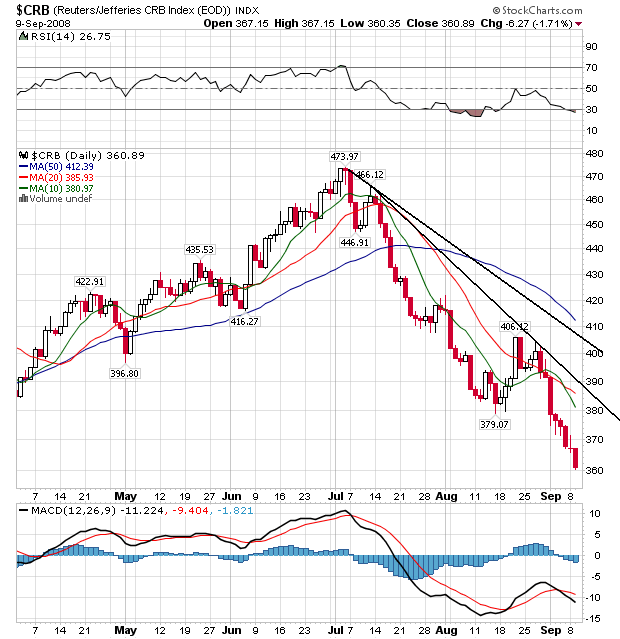
On the daily chart, notice the following:
-- Prices have been dropping for two months
-- All the SMAs are moving lower
-- The shorter SMAs are below the longer SMAs
-- Prices are below all the SMAs
This is about as bearish as you can get on a daily chart.