We're going to use several charts today. First -- here's the big headline grabbing chart. The market fell out of bed today with the SPYs dropping 9.61%. Also note the heavy selling at the end of trading. Traders clearly did not want to own anything going into tomorrow.
On the 10 day chart, notice that last week we lost a ton. The market dropped from 114 to 84, or a loss of 26%. But note that we're still within the wide range established over the last two weeks.
Most importantly, remember that a I mentioned the market appears to be in a wide trading range/consolidation period. Note the four days ago we had a huge volume sell-off. This may have been a selling climax. Also note the market is extremely oversold right now by most technical indicators. Here's a chart of the RSI, MACD, Chaiken money Flow, Williams Percentage Number and Accumulation/Distribution for the current price level:
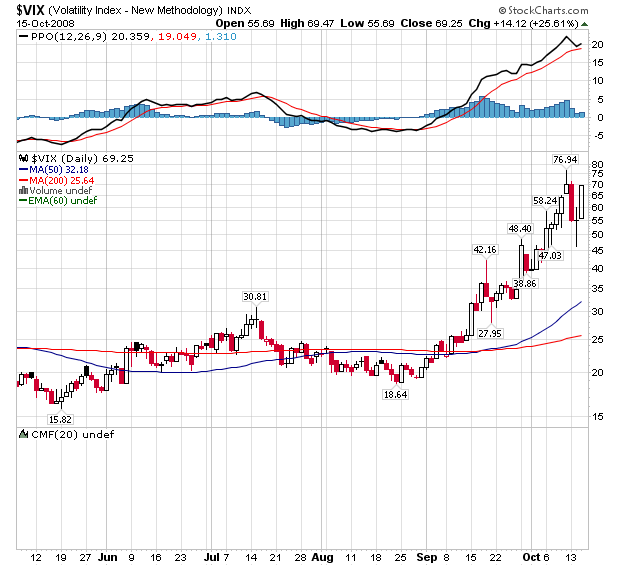
But we're also in a period of high volatility.
Until I see the market drop below roughly 84 I still think we're consolidating. There's been a great deal of fundamental action to stabilize the financial sector. Most traders know the economy is in a recession and have traded the market accordingly -- we're already at 2003 levels.