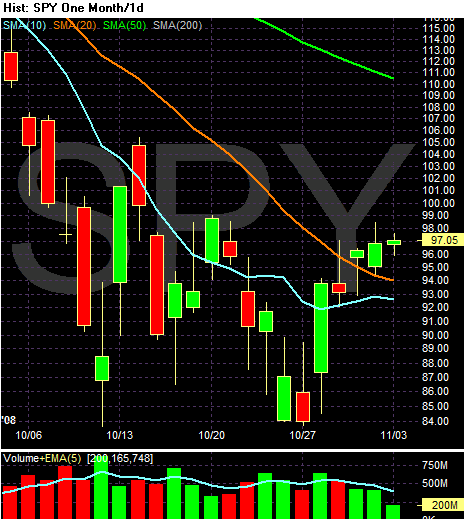
On the daily chart, note the followingl
BULLISH:
-- Prices are above the 10 and 20 day SMA
-- The 10 day SMA is moving wideways
BEARISH:
-- The 20 and 50 day SMA (longer-term averages) are moving lower
-- The shorter SMAs are below the longer SMAs
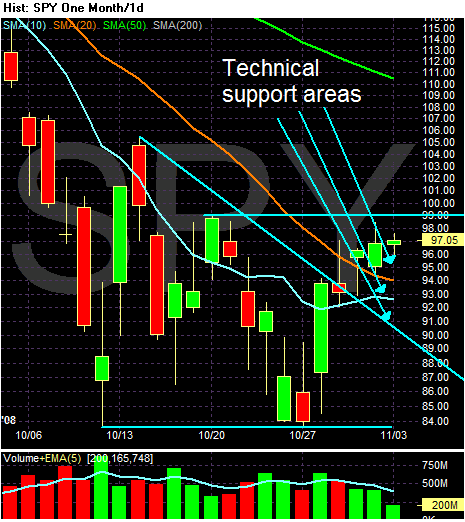
However, I do want to point out there are three possible technical support levels for prices right now -- the 10 and 20 day SMA along with the upper level of the consolidating triangle. In addition, note that prices have clearly broken out of the triangle consolidation pattern.
Bottom line: this is a mixed market -- it's looking for a reason to move convincingly in one direction or the other.