Friday, April 11, 2008

Weekend Weimar and Beagle


Fooled you -- I had a wonderful female Rott named Ella for 12 great years. She was the kindest, gentlest animal I have ever met. She was the sweetest dog ever. I had to put her down almost two years ago and I still miss her. I probably always will in some way or another.

So, in tribute to my former Ella, here is a picture of a Rottweiler -- one of the greatest breeds ever.

It's time to stop thinking about the market and the economy. Go do anything except think about those two things.

I'll be back on Monday morning.

Import Prices Spike Hard

From the BLS:

The U.S. Import Price Index increased 2.8 percent in March, the Bureau of Labor Statistics of the U.S. Department of Labor reported today, as higher prices for both petroleum and nonpetroleum imports contributed to the advance. The rise followed 0.2 percent and 1.5 percent increases in February and January. Export prices rose 1.5 percent in March, after advancing 1.1 percent and 1.2 percent for the prior two months.

The price index for overall imports rose 2.8 percent in March, led by a 9.1 percent advance in petroleum prices. Petroleum prices resumed an upward trend following a 1.9 percent downturn in February. Prices for petroleum rose 60.0 percent for the year ended in March following a comparatively modest 3.1 percent rise over the previous 12-month period. A 1.1 percent increase in nonpetroleum prices also contributed to the overall rise and was the largest one-month increase for the index since nonpetroleum prices were first published on a monthly basis in December 1988. The price indexes for overall imports and nonpetroleum imports also advanced for the March 2007-08 period, increasing 14.8 percent and 5.4 percent, respectively.


Here's the chart from econoday:


For those of you who want some more info, here are two pieces I wrote earlier this week:

What inflation

What inflation, part II.

This Thing Isn't Over By a Long Shot

From the WSJ:

The weakening U.S. economy has further to fall, according to the majority of economists in the latest Wall Street Journal forecasting survey.

By a 3-to-1 ratio, respondents said the economy is in a recession, and almost three-quarters said the economy hasn't yet hit bottom. "It's hard to say," said Lou Crandall of Wrightson ICAP, because "it doesn't feel like anything we've experienced in decades."


First, I called for a recession about a year too early. I thought we'd be in a recession in the Spring of 2006. So my prognostication abilities are about as sharp as .... the average economist's.

That being said, this thing is just getting started.

Here's the central problem: the Fed is pouring money into the financial system. Yet interest rates are still spiking:


This indicates that financial firms aren't willing to make loans to each other.

That's because everyone is still writing down the value of mortgage paper. And we're going to continue to hear news along those lines for some time:

The total potential losses globally from the credit crunch could top $945 billion, the International Monetary Fund estimated on Tuesday. Losses tied to the housing market could top $565 billion, with the remainders coming from credit cards, commercial real estate and corporations, the IMF said. The current market turmoil reflects weak balance sheets and a general lack of capital.


And the credit crisis is spreading:

Forty-six student lenders have stopped making federally guaranteed student loans, either temporarily or permanently.

Distress in the $330 billion market for auction-rate securities in recent months has rippled into the student loan market, and several states have suspended their college loan programs. The 46 lenders accounted for 12 percent of the federally backed student loan market, according to FinAid.org, a Web site focused on student lending.

Companies including Washington Mutual Inc., Sovereign Bancorp Inc., College Loan Corp., CIT Group Inc., NorthStar Education Finance Inc., HSBC Bank USA and Zions Bancorp have stopped issuing federally guaranteed student loans in recent weeks. And state agencies in Iowa, Michigan, Montana and Pennsylvania have suspended college loan programs.

The major federal student loan program is providing an estimated $50 billion in loans to 6.4 million students in the current academic year.


Don't think it's going to stop there.

Fourth Airline Seeks Bankruptcy Protection

From Bloomberg:

Frontier Airlines Holdings Inc., the U.S. discount carrier that serves 70 destinations from Denver, filed for bankruptcy protection, becoming the fourth U.S. airline to do so in less than a month.

Frontier took the step after its main credit-card processor began withholding proceeds from ticket sales, it said in a statement today. The carrier pledged to continue flying and keep paying workers while it seeks additional financing.

``We filed for very different reasons than those of other recent carriers,'' Frontier Chief Executive Officer Sean Menke said in the statement. ``Fortunately, we believe that we currently have adequate cash on hand to meet our operating needs while we take steps to further strengthen our company.''

Frontier Airlines has debt of $500 million to $1 billion and about the same in assets, according to Chapter 11 documents filed with the U.S. Bankruptcy Court in Manhattan. A slowing economy and jet fuel costs that have risen 60 percent in a year were blamed for recent filings of Skybus Airlines Inc., Aloha Airgroup Inc. and ATA Airlines Inc.

In Asia, long-haul budget carrier Oasis Hong Kong Airlines Ltd. ceased flying after 17 months on April 9, stranding thousands of people in Hong Kong, the U.K. and Canada. Chairman Raymond Lee cited the spiraling price of fuel for the step.


This is one of the biggest impacts from spiking fuel costs -- spiking transportation costs. Anyone who is not seeing inflation bleeding into every nook and cranny of the economy just isn't looking closely at the big picture.

Howard Lindzon offered some colorful (and deadly accurate) commentary about the airlines:

We are one disaster away from another massive airline bailout ‘crisis’ and other than the airline industry itself, the market could care less. All media eyes are focused on the Bear Stearn’s hearings, but forgets the bazillions the government pissed away after 9/11 saving unsavable businesses and useless executives. NO PAYBACK on those crappy loans.

I am always amazed that our piece of shit Airlines can keep planes in the sky. The same crew of cowboy (they call themselves that)/criminal executives has no incentive to make money.

They have everyone to point fingers at to deflect childlike operating prowess. Unions, Wages, Fuel, Maintenance, Terrorism….

If you are a common shareholder you are being raped.

I am first to be thankful that we are free to fly. It is one of our greatest freedoms, but we need a real plan. Obviously, nationalizing won’t work.

The prices of flying are completely ridiculous. Because it is one of our greatest freedoms, not priviledges, the price should truly reflect the freedom. If anywhere close to true competition existed, ticket prices would be much higher and we would have cheap/workable video conferencing. We would lose Vegas, but let’s face it…Vegas is lame.


He's right about the increasing possibility of a bail-out occurring. Four bankruptcies in a month is a sign there is something really wrong with the current structure of the business.

Short version -- the airlines are clearly in very deep trouble right now, and we have the following chart to thank for it:


Let's look at the airline industry charts. Prophet.net breaks them down into two areas -- the majors and the regionals:


The majors were clearly in a funk until mid-2006 when they broke out. The spike in 2007 is probably the result of a merger rumor (although I can't remember exactly what the story was. Anyone who remembers please chime in). But the majors have dropped with the rest of the market since last summer.


The regionals were also in a funk for most of the latest rally. They broke out in late 2006, but broke that trend at the end of last summer along with the rest of the market.

I see no reason to think this sector will do anything except languish for the foreseeable future. Between rising oil and a slowing economy that will diminish traveling, the airlines are getting hit from all fronts.

How To Fix The Credit Crisis

From the AP

The world's top financial officials, shaken by a credit crisis that has roiled markets around the world, are working on regulatory reforms that they hope will restore confidence in the markets.

The plan they have under consideration seeks to boost transparency, strengthen the role of credit rating agencies and bolster cooperation between regulatory authorities in major countries.

Those proposals will be explored Friday when finance ministers and central bank presidents from the world's seven richest industrial countries meet in Washington for discussions to be led by Treasury Secretary Henry Paulson and Federal Reserve Chairman Ben Bernanke.

The discussions, which will also include the top finance officials of Japan, Germany, Britain, France, Italy and Canada, are taking place in advance of the weekend meetings of the 185-nation International Monetary Fund and its sister lending institution, the World Bank.

The financial officials are gathering eight months after a credit crisis, which began in the United States with rising defaults on subprime mortgages, has now spread around the globe. It has caused major financial institutions to declare billions of dollars in losses and brought Bear Stearns, the fifth largest investment bank in the United States, to the brink of bankruptcy.


Although it's a bit late to get out of this mess, it's the perfect time to look at how we keep this from happening again. Let's start with what went wrong this time.

Let's compare how mortgages use to work and how they work now to demonstrate the differences between the old and new system. It use to be that people went to a financial institutions (we'll call it Mom and Pop Bank) and the bank held the mortgage for the entire duration of the loan. That is, the borrower's payments went directly to the bank that made the loan for the entire duration of the loan. That's because the bank actually held the loan for that period of time.

Fast forward to now where a completely different process has taken hold. The mortgage broker sells the loan to a smaller bank who then sells the loan to a larger bank who then packages the loan into a pass-through security which is sold to a large institutional investor. Somewhere along the way the packaged security is given a solid rating from a ratings agency so that a large number of institutional investors can buy the security.

The really big difference is the highly fragmented process of loan underwriting and selling. Bernanke observed this in recent testimony before Congress. It is also what has to be overcome to prevent this process from happening again. So here's what we do.

1.) There has to be someone looking over the shoulder of mortgage brokers or anybody that originates loans. They have demonstrated they cannot be trusted to make solid decisions on a consistent basis.

2.) Investment banks that pool mortgages need to perform far better underwriting standards as well. The SEC really fell down on the job on this one. Again -- this comes down to more oversight pf the street.

3.) The ratings agencies -- after first being taken out and publicly dressed down for their complete abject failure to perform any meaningful due diligence -- also need to have someone looking over their shoulder when it comes to ratings. S&P, Moody's and Fitch have all demonstrated they have absolutely no ability to properly rate securities.

What this comes down to is a simple phrase: more regulation (it's not like that should be surprising). As I've said before, capitalism is based in part on greed. But the regulatory system has to control and direct the greed. Unfettered greed is what leads to problems like this.

Thursday, April 10, 2008

Today's Markets

Maybe one of the reasons for sluggish retail sales is gas prices are hitting records. We also learned the credit crunch has forced 46 lenders to stop making student loans. And we learned that airlines calcelled more flights ticking off more people (again). There was some good news from the airlines: Delta's pilots agreed to a a contract for a merger deal with Northwest. While initial jobless claims fell to 357,000, the 4-week moving average is still the highest it's been in two years.


The markets rose and then fell into the close today. But the real story is how the SPYs are focusing on the 136 level; for some reason, that price level is attracting a lot of attention.


The big news today was the big rally on the NASDAQ, which rallied 1.43%. The big news here was the continuing moves on Yahoo.


But, we also saw a big move on the IWMs.

However, looking at the charts from above, it's obvious we're still in a trading range of a few points on all the averages. After seeing big gain on Tuesday 4/1, we've seen the markets barely budge. While the news has been pretty negative since then, we haven't seen a huge drop. My best guess is the Fed's backstop of opening up the discount window to investment banks is really backstopping the market as a whole right now. I have to proof for that; it's just a gut level feeling.

Retail Sales Disappoint

From the AP:

The nation's retailers reported the weakest March sales in 13 years on Thursday as consumers -- fretting about mounting economic problems and enduring a frigid Easter -- limited their shopping to food and other essentials.

With prices at the pump rising and worries about jobs increasing, shoppers bought basics at discounters and wholesale clubs and snubbed mall-based chains' clothing, jewelry and furniture. The earliest Easter in 95 years also hurt sales; shoppers weren't in the mood to buy spring clothing in cold weather.

Wal-Mart Stores Inc. and Costco Wholesale Corp. were among the best performers. Wal-Mart raised its earnings outlook, noting that better inventory control helped to limit markdowns on merchandise.

But March proved to be another weak month for many others, including J.C. Penney Co., Gap Inc., and Limited Brands Inc. All of them reported sharp drops in sales.

"Discounters are going to continue to do well in this economy," said Ken Perkins, president of RetailMetrics LLC, a research company in Swampscott, Mass. "Anything that is discretionary is going to continue to be under pressure."


Here's a link to a sortable chart from the WSJ.

The bottom line is weakening job growth


Rising unemployment (although still at low levels)


Declining disposable income


Leads to lower confidence


And sentiment


Which lowers sales.

Let's take a look at the retail sector chart across a set of time frames


On the five year chart, notice the following:

This is a daily increment chart. Notice how prices are moving around the 200 day SMA. While there is a slight upward slope to the line, this is not the strongest slope we've ever seen. It's as much trading range as it is a rally.


Starting in July of last year, notice the chart starts to move lower in a big way. The chart is making lower lows and lower highs. Also note prices are about 10.6% below the 200 day SMA, indicating we're in a bear market area.


On the three month SMA chart, notice the following:

-- Remember that prices are below the 200 day SMA

-- The shorter SMAs are all moving lower

-- The 10 is below the 50 and the 20 is about to cross below the 50

-- Prices are below all the SMAs

Short version: this chart says sell me.

Securitizations Will Stay Around

From IBD:

Just like junk bonds in the 1980s, this decade's mortgage-backed securities carry the demon label.

Back then, brainy bankers repackaged high-yield junk into complex securities, just like subprime mortgage debt.

Still, junk bonds rebounded. Most high-yield debt issued by U.S. companies now goes toward general corporate purposes, not buyouts like 25 years ago.

Mortgage-backed securities will bounce back, too, experts say, though reforms are much needed.

"Junk bonds are an interesting analogy," said Robert van Order, professor of finance at the University of Michigan and a former chief economist at Freddie Mac. (FRE)

"It's very much the same idea, that these were risky loans, and deals were set up to go through the bond market," he added. "The key going forward is that loan originators take bigger equity positions in securities, that they keep more skin in the game. And investors will look for more transparency and information in deals."


I am very glad that someone wrote this article.

As my screen name implies, I use to be involved with the bond market. I was a bond broker with several regional firms, although now I am in graduate school studying for an LLM in international taxation. As such, I have some familiarity with the market that is currently being trashed in the press. Here are some points we need to remember.

If memory serves, the first pass-through mortgage deal was done in the late 1970s or early 1980s. It was a simple pass through deal, meaning all that was really involved is an investment bank bought a lot of mortgages with similar coupons and maturities, put them in to a pool, and then sold it to a third party. By today's standards, it was an incredibly simple deal. But, those types of securities are still around.

The process started to get more complicated when investment banks started to "carve cash flows" from the same pools of mortgages. This means that instead of there being only a single pool of mortgages that was sold to a third party, there were now multiple bonds with different maturities and interest rate characteristics. For example, there were now "interest only" bonds or IOs which only paid the interest from the mortgages to the bondholder and its flip-side "principle only" or PO bonds (which worked in a very similar way to zero coupon bonds).

The point here is investment banks learned that fixed-income investors had different needs. For example, an insurance company with a particular anticipated liability stream may not need money until a particular pay window opens up. For example, an insurance company that deals in auto insurance may anticipate they will need to pay out $5,000,000 in three years (and yes, their actuaries are that good and accurate). So they need a zero coupon bond that will mature say a month or two before that liability stream opens up. As such they purchase a zero coupon bond or PO to solve that need. Now, everybody is happy.

These types of bonds are called "collateralized mortgage obligations" or CMOs and they started to get a bad reputation in the late 1980s and early 1990s. Several prominent municipalities (of which I think Orange County California was one) had their portfolios go belly-up or close to bankruptcy because of CMOs. As a result of those stories CMOs got an extremely bad reputation. Frankly, I forget what the exact facts of the situation were -- that is, I forget how the portfolio was structured etc....

Let's fast-forward to now. A lot of the alphabet soup of names you're seeing in the financial press are getting hit really hard. For example, collateralized debt obligations (CDOs) and collateralized loan obligations (CLOs) are now getting hammered just as hard as CMOs use to be. Both of these types of securities are based on the same concepts as CMOs; that you can carve different case flows from a pool of collateral to serve a variety of needs. There is nothing inherently wrong with that idea now, just as there was nothing wrong with it 15 or 20 years ago.

So -- what went wrong?

A lot. The main issue over the last 3-5 years is a complete breakdown of underwriting standards. Mortgage brokers had no incentive to verify income, instead going for fat commissions that riskier loans offered. Investment banks had no incentive to verify collateral's characteristics because the bank was going to sell the collateral anyway. And the ratings agencies gave everything a AAA rating without much thought.

As a result, there is a lot to fix. But that doesn't mean the basic concept is wrong or should be abolished. It shouldn't be because the raw idea is still sound and has a track record of success. But there are a lot of things that need to change.

For more on CMOS - here is a link to the wikipedia entry which is really good.

What Inflation?

From the WSJ:

Inflation is back.

After several years of relative stability, a wave of rising prices is washing over the world economy.

It comes at a most inconvenient time. The Federal Reserve is sharply cutting U.S interest rates -- the opposite of the usual response to rising inflation -- to prevent the housing bust and credit crisis from causing a deep, prolonged recession. That's making the global response to inflation more complicated.

.....

On Wednesday, the World Bank estimated global food prices have risen 83% over the past three years, threatening recent strides in poverty reduction. The IMF forecast consumer prices in emerging and developing countries will rise 7.4% this year, the most inflation since 2001 though still well below the double-digit levels of the recent past.

.....

But the fact that inflation is rising almost everywhere suggests some of its causes are global. As crops are sold for alternative-energy production, food prices have soared: The price of rice, the staple for billions of Asians, is up 147% over the past year. Increasing demand for natural resources among developing economies such as India and China has pushed up prices for raw materials world-wide. Oil-supply constraints have sent crude-oil futures surging above $112 a barrel Wednesday, a new record, resulting in rising fuel and transportation prices.

The weakening U.S. dollar is another source. Not only is it pushing up prices of American imports, it is transmitting inflation to the dozens of economies that link their currencies to the U.S. dollar, from Saudi Arabia to Hong Kong to Mongolia. Because of their currency pegs, these economies are forced to track Fed rate cuts even if they aren't facing recession. That is putting upward pressure on their prices. Additionally, years of easy credit earlier this decade -- the result of a global quest to avoid falling prices, or deflation -- are a contributing factor.


We've been talking about this trend for some time now. Here's what the Fed saw in their latest minutes:

In the United States, the headline CPI continued to rise rapidly in January but was flat in February. For those two months on average, the rate of headline inflation was down significantly from its elevated level in the fourth quarter of 2007, as retail energy prices stopped rising and core inflation moderated a bit; these two factors more than offset an acceleration of food prices. However, the increase in world petroleum prices in early March pointed to a renewed burst of energy price inflation in the near term. Available information, including producer prices for February, suggested that prices of core personal consumption expenditures (PCE) moved up a bit more slowly than the core CPI in January and somewhat faster than the core CPI in February. Household survey measures of expectations for year-ahead inflation jumped in March to their highest levels in about two years; in contrast, survey measures of longer-term inflation expectations were unchanged or up slightly.


And here's what they saw in their latest policy statement:

Inflation has been elevated, and some indicators of inflation expectations have risen. The Committee expects inflation to moderate in coming quarters, reflecting a projected leveling-out of energy and other commodity prices and an easing of pressures on resource utilization. Still, uncertainty about the inflation outlook has increased. It will be necessary to continue to monitor inflation developments carefully.


So -- what does all of this mean?

First, this is not going unnoticed. At the policy level that is extremely important. Once the inflation genie gets out of the bottle it's incredibly difficult to get back in. The last thing anybody wants is to play catch-up to inflation.

Secondly, the Fed is in a terrible policy bind. On one hand, they have an economy to mend and a financial system to fix. Central to fixing both is greasing the wheels of capitalism, which means lowering interest rates. But that helps to encourage inflationary growth at a time when inflation is already increasing.

Third, the US is no longer the world's only leading consumer of raw materials. As such, a slowdown in US demand won't be the world-wide cure all for spiking inflation. We have to rely on India and China to deal with their respective inflationary levels.

Wednesday, April 9, 2008

Today's Markets

Welcome to the world of energy inflation as oil crosses $112/bbl although it closed lower. Corn also hit a new record. Merrill Lynch reported it will writedown an additional $6 to $6.5 billion in loans when it reports earnings. American Airlines canceled 1000 flights for maintenance reasons (is any airline doing any maintenance?). The dollar closed near its all-time low with the euro.


Yesterday I said the big story was whether or not the SPYs would hold support at the 136 area. They didn't, and they brought down the other averages. 134.50 is still the next area of downside support.


The QQQQs went down with the SPYs. They fell hard in the morning but staged a late-day recovery rally. Look for support in the 44.40 area.


The IWMs were consolidating in a triangle pattern. Once they fell through they fell hard. Look for support in the 69.40 area.

Why Transports Matter

From Marketwatch:

United Parcel Service Inc. cut its first-quarter earnings range, surprising analysts, as the delivery giant got chilled by the same bitter economic headwinds affecting everything from airlines and automakers to banks and retailers.

The profit warning appears to be weighing on financial markets in early action on Wednesday, with S&P 500 futures down 6.8 points to 1,364.20 and Nasdaq 100 futures off 5.75 points to 1,849. Dow industrial futures fell 46 points. See Indications.

UPS shares fell 3% to $71.15 in pre-market trades.

After the closing bell on Tuesday, the Atlanta-based package transport firm said it now expects a profit of 86 cents to 87 cents a share, down from a range of 94 cents to 98 cents a share. Analysts polled by FactSet Research previously had targeted earnings, on average, of 93 cents a share.

"The U.S. economy has continued to weaken, causing a reduction in domestic package volume and a shift away from premium products. Significantly increased fuel costs in the quarter also contributed to the lower than expected results," UPS said in a statement.


A good report from a transportation company indicates the economy is doing well. The converse is also true.

Last week I wrote an article titled, "Are Transports Signaling a Rebound? I made the following points:

-- The technicals were improving,

-- There was continued chatter about consolidation in the airline industry.

An astute reader pointed about that airlines represent a small portion of the IYT's and therefore the stories linked to them aren't as important for this particular index. This was a very good observation.

I concluded that the real issue for the transport index would be crossing a long-term support line started in early 2004:


The big issue is a rally above the previous long-term support line. And remember the move through that doesn't have to happen on the first time. So keep your eyes open.


Here's a chart of the IYTs


Notice the following:

-- The index rallied from a head and shoulders formation

-- Prices are higher than the 200 day SMA

-- The 10, 20 and 50 day SMAs are all moving higher

-- The 10 and 20 day SMA moved through the 200 day SMA, and the 50 is getting ready to

-- The 10 SMA is higher than the 20 SMA which is higher than the 50 day SMA -- a bullish configuration

-- But, volume has been decreasing as the market is moving higher, indicating a lack of interest on the part of buyers.

Again -- the big issue is getting about the long-term support line. That will be the best tell this market can give us.

What Inflation?

From the WSJ:

Federal energy officials expect oil to average $101 a barrel this year, a sharp upward revision from its earlier forecast that suggests prices will remain above $100 for some time.

But the U.S. Energy Information Administration expects American drivers, truckers and airlines to use less fuel this year as the economy softens. That could take some pressure off prices for gasoline and other fuels, and could keep the price of gasoline under a U.S. average of $4 a gallon.

Just months ago, $100-a-barrel oil seemed an aberration -- a price surge driven by speculators that would soon slip back to more reasonable levels. But the move by the agency -- usually a price bear that had predicted $87-a-barrel oil in January -- suggests $100 oil could be the new norm this year.The arm of the U.S. Energy Department also doesn't anticipate much relief next year, when it sees prices averaging $92.50 a barrel.

Crude oil for May delivery fell 59 cents a barrel, or 0.5%, to $108.50 Tuesday on the New York Mercantile Exchange. Oil hit a record high of $110.33 March 13.

Contrary to warnings from many analysts, the agency believes gasoline prices will remain below $4 a gallon in the U.S. during the height of the summer driving season. The government sees gasoline prices peaking in June at $3.60, up from the national average of around $3.33 now. The U.S., consumer of nearly a quarter of the world's daily crude production, is expected to use 85,000 barrels a day less this year in liquid fuels than in 2007, the agency said.


No one really knows where prices will end up -- despite their best intentions and good faith efforts to try and figure it out. However, here is the basic issue with energy demand: so long as India and China are still growing at strong clips, expect more upside price pressure. Those two countries add 2 billion people to the demand side of the equation.

Let's look at some charts.


On the daily for oil, notice the following:

-- Prices were in an uptrend from early February to early March

-- Prices broke this trend, but have remained above the $100 level

-- Prices are consolidating above $100 level in either a triangle or rectangle formation

-- The 10 and 20 day SMAs are bunched together, indicating they are looking for direction.

-- Prices remain above the 50 SMA


On oil's weekly chart, notice the following:

-- Oil started a rally at the beginning of last year.

-- Throughout the course of that rally, oil has moved through resistance and then consolidated price gains.

-- It has used the 10 and 20 week SMA as support

Short version: oil's charts are incredibly strong and show no sign of reversing.

As a result, prices are the pump are noticeably higher.


As a result of high fuel prices, we're starting to see protests from truckers:

Tons of freight idled across the country Tuesday as independent truckers pulled their rigs off the road while others slowed to a crawl on major highways in a loosely organized protest of high fuel prices.

Using CB radios and trucking Web sites, some truckers called for a strike Tuesday to protest the high cost of diesel fuel, hoping the action might pressure President Bush to stabilize prices by using the nation's oil reserves.

"The gas prices are too high," said Lamont Newberne, a trucker from Wilmington, N.C., who along with 200 drivers protested at a New Jersey Turnpike service area. "We don't make enough money to pay our bills and take care of our family."

On the Turnpike, southbound rigs "as far as the eye can see" staged a short lunchtime protest by moving about 20 mph near Newark, jamming traffic on one of the nation's most heavily traveled highways, authorities said.


While we're looking at commodity prices, let's look at agricultural prices because they have also been spiking


On the daily chart, notice the following:

-- Price have broken through the support of an upward sloping trendline started in late November 2007

-- Prices are below the 50 day SMA and are heading lower

-- The 10 day 20 day SMAs are both headed lower and have moved through the 50 day SMA

-- Prices are consolidating below the 50 day SMA


-- Prices have continually moved through previously established resistance and consolidated those gains

-- Prices are still in a confirmed uptrend

The reason agricultural prices are so important is there are food riots in various countries across the globe and governments are curbing exports:

As well as the riots in Egypt, rising food costs have been blamed for violent unrest in Haiti, Ivory Coast, Cameroon, Mauritania, Mozambique and Senegal. Protests have also occurred in Uzbekistan, Yemen, Bolivia and Indonesia.

China, India, Pakistan, Cambodia and Vietnam have curbed rice exports to ensure there is enough for their own people.


Most commodities are priced in dollars. Therefore a dropping dollar is a de factor price increase.


On the daily chart, notice the following:

-- Prices consolidated in the 74 - 77 range from late November to late February.

-- Prices broke through support and have since fallen about 3.3%

-- Prices are consolidating in a triangle consolidation pattern

-- The 10 and 20 day SMAs are bunched together, indicating a lack of direction.


On the weekly chart, notice the following:

-- Prices have continually moved lower, falling through support

-- After falling through support, prices have consolidated their drop and then moved lower

-- The shorter SMAs are below the longer SMAs

-- Prices are below the SMAs

All of this leads to high inflation in the US:


Tuesday, April 8, 2008

Today's Markets

There wasn't much to cheer about today. The IMF announced they think total losses from the mortgage meltdown will total about $945 billion. We also learned the pending home sales fell. The FOMC minutes showed the Federal Reserve thinks we'll see a contraction in the first half of the year. There was some bad news on the corporate front as well. Morgan Keegan cut Apple shares to a sell. Alcoa reported a profit drop and AMD said it was laying off 10% of its workforce. In short, this was not a happy day.


Taking a look at the SPYS chart from left to right here's what we see.

-- A big rally a week ago that peaked on Wednesday.

-- On Wednesday we had a natural sell-off.

-- From Thursday through Monday of last week we say another rally, although this one was a but narrower.

-- Yesterday the market closed below the lower trend line

-- Today we saw a continuation of the sell-off.

-- Notice that 136 is a very important short term level.

-- Also note that if prices break 136, the next level is 135.5


-- The QQQQs also also saw a big rally last Tuesday, followed by another rally on Thursday through Monday

-- Notice there was a possible double top on Friday and Monday

-- Also notice prices are in a downward sloping trendline

-- 45.20 is a very important level. If we break through this level than 44.80 becomes the next level of support


-- A great deal of overlap with the QQQQ and SPY analysis with the following differences

-- Notice the triangle consolidation pattern yesterday and today

-- 74.40 is an important level, although IWM prices are a bit above their respective support levels than the SPYs or QQQQs

Because the markets usually trade in tandem, a drop by the SPYs through their support level would not be good for the markets overall. That would pull the markets lower in a big way.

A Closer Look At the S&P 500's Industry Sectors

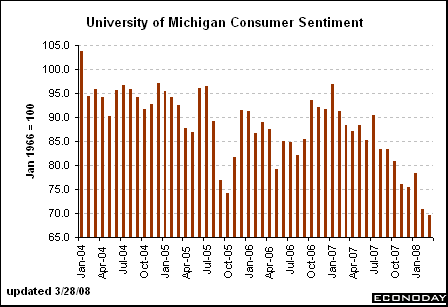
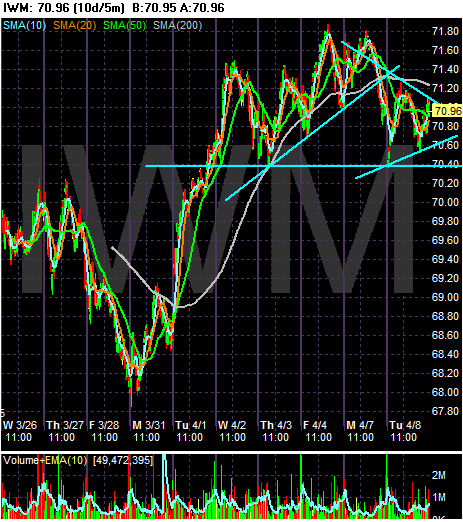
This morning I'm going to look at the short-term (6 month) charts of the 9 sectors that comprise the S&P 500. I'm going to look at them in reverse alphabetical order (just to keep things interesting).


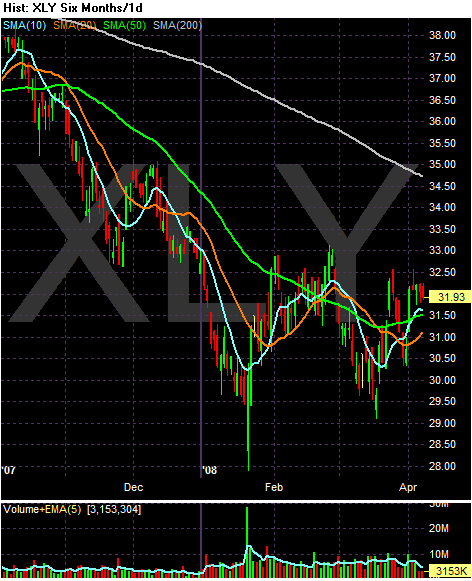
On the XLY's (Discretionary Income) notice the following:

-- The ETF has been in a 2.5 point trading range since the beginning of the year. This could be indicating the sector is bottoming out.

-- Before 2008, sector was in a clear downtrend

-- The index is (approximately) 10.6% below the 200 day SMA, indicating we're in a bear market.

-- The 200 day SMA is heading lower

-- The 10, 20, and 50 day SMAs are bunched up within a point of each other. While all of these SMAs are headed higher, the fact they are bunched-up like this indicates there is an overall lack of conviction among traders to move the sector in either direction.


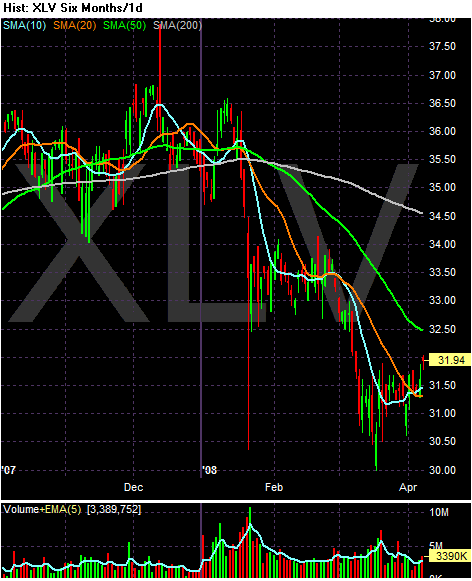
The Health Care sector is oddly enough declining. I say oddly because health care issues are typically a safe haven investment that gets cash inflows when times are hard. But the chart says otherwise. Notice the following:

-- Prices are 7.4% below the 200 day SMA

-- Prices have dropped hard twice since the beginning of the year.

-- The 20, 50 and 200 day SMA are both headed lower

-- While the 10 day SMA has crossed over the 200 day SMA within the last few days, this is not the greatest event because of the general downward trajectory of the other SMA


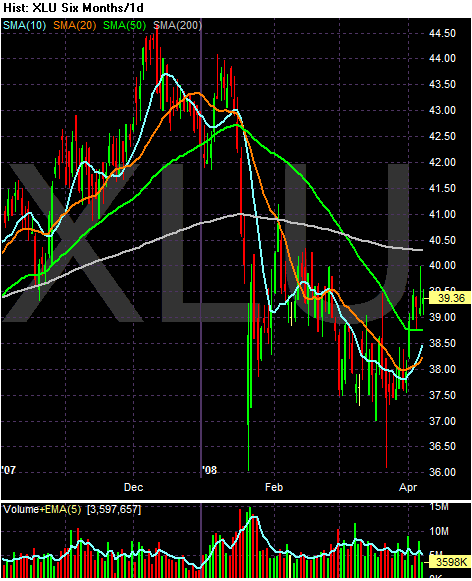
The utilities have also taken a hit. Notice the following:

-- Prices are about 2.6% below the 200 day SMA -- just barely in negative territory.

-- The shorter SMAs are below the longer SMAs (which is bearish) but --

-- The 10 day SMA just crossed the 20 day SMA, and

-- Prices are above the 10, 20 and 50 day SMA.

-- The index may have formed a short-term double bottom with the first bottom occurring at the end of January and the second occurring at the end of March.


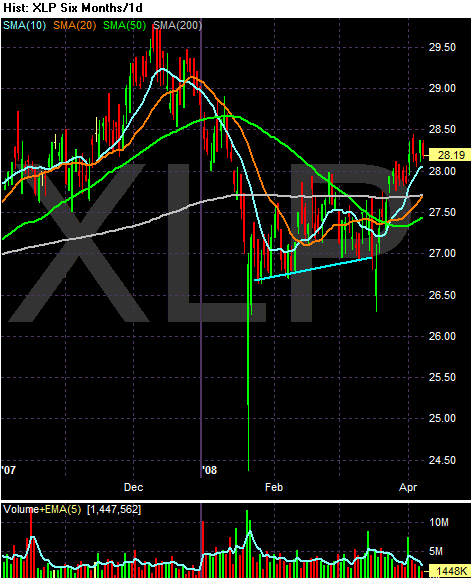
On the consumer staples chart, notice the following:

-- Prices are over the 200 day SMA (although just barely)

-- The 10 day SMA is above the 20 day SMA, which is above the 50 day SMA -- a generally bullish configuration

-- the 10, 20 and 50 day SMAs are all moving higher, although the 50 day SMA is just turning positive.

-- The 10 day SMA crossed over the 200 day SMA and the 20 day SMA is just about to.

-- Prices are higher than all the SMAs which is generall a bullish configuration


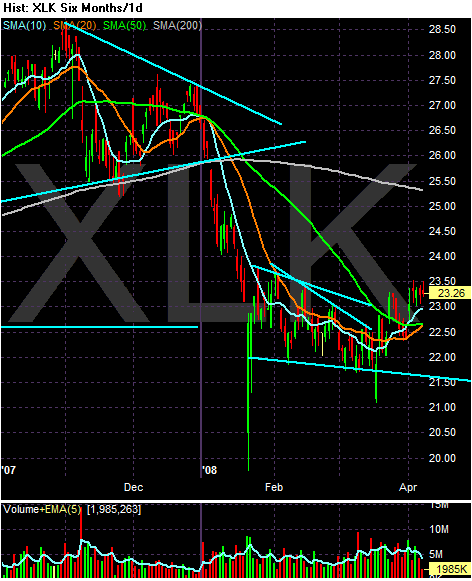
Regrading the technology sector, notice the following:

-- Prices are about 8.4% below the 200 day SMA

-- The 10 and 20 day SMAs are headed higher

-- The 10 day SMA is higher than the 50 day SMA

-- the 20 day SMA is about to cross over the 50 day SMA

-- The index is breaking out of a consolidation pattern it has been in since the end of January


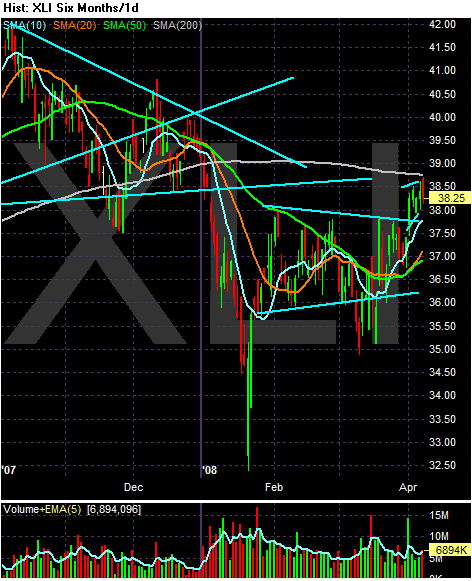
On the industrials chart, notice the following:

-- Prices are just below the 200 day SMA

-- The 10, 20 and 50 day SMA are all increasing

-- The 10 day SMA is higher than the 20 which is higher than the 50 -- a bullish orientation

-- Prices are higher than the shorter SMAs

-- Prices have broken out of a consolidation pattern that started in late January

I dealt with the XLFs yesterday in this post


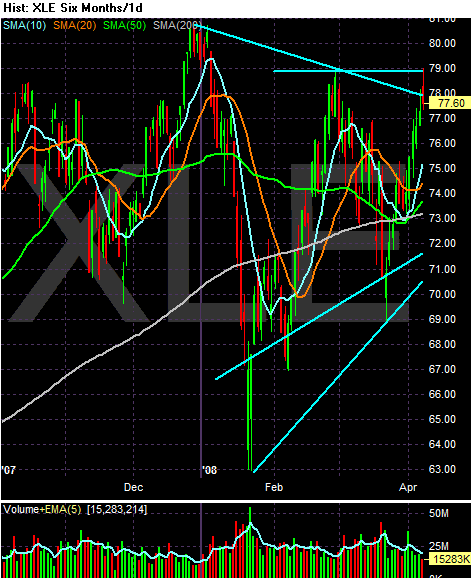
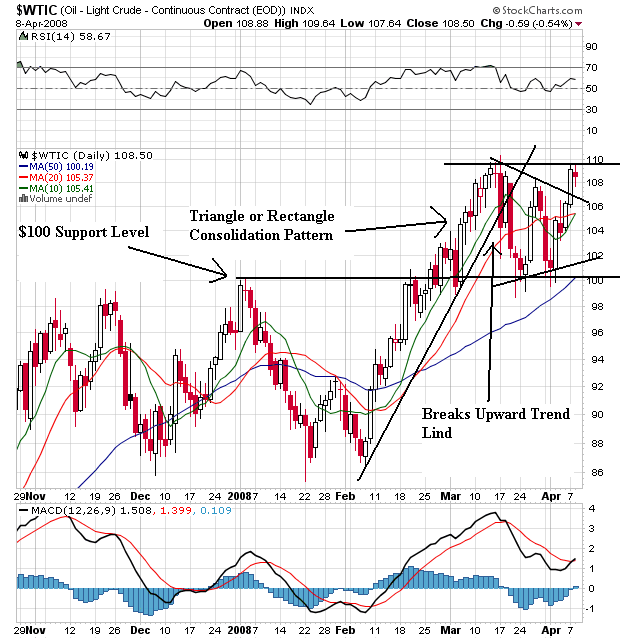
In the energy sector, notice the following

-- Prices are about 5.6% higher than the 200 day SMA

-- The 10, 20, and 50 day SMA are all moving higher

-- The short-term SMAs are above the longer SMAs

-- All the SMA are moving higher

-- The main bad news is the SMAs are bunched together


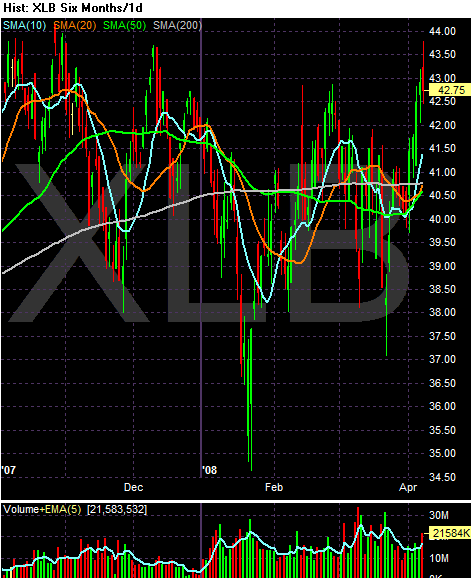
On the basic materials chart, notice the following:

-- Prices are about 3% above the 200 day SMA

-- The 10 day SMA crossed over the 200 day SMA

-- The 20 day SMA is about to cross over the 200 day SMA

-- The 10, 20 and 50 day SMA are all headed higher

-- The 10 day SMA is higher than the 20 day SMA which is higher then the 50 day SMA -- a bullish orientation.

-- The main problem with this chart is the SMAs are bunched together.

Monday, April 7, 2008

Today's Markets

The big news today was that all the averages broke through key support levels.


The SPYs break is small but noticeable. The key here is tomorrow's move. Usually prices have to break a trend by a certain amount for the trend break to be a "real" break. In his book on technical analysis, Pring suggests a break of 3%. For a shorter term chart, I would use a smaller figure.


Notice the QQQQs dropped a bit father through their trend line.


And the IWMs broke through their trend with a bit more gusto as well.

The daily charts show an interesting story.


The QQQQs daily chart is the first chart that caught my attention. Notice the following:

-- The 10 and 20 day SMAs are heading higher.

-- The 10 has crossed the 50 day SMA and the 20 will cross the 50 day SMA tomorrow

-- the 50 day SMA is heading higher

-- Prices are higher than all the moving averages

-- Prices are in the middle of an uptrend

-- A big drawback to this chart is the lack of volume


On the IWMs notice the following:

-- The 10 and 20 day SMA are moving higher

-- The 10 day SMA crossed the 50 day SMA and the 20 day SMA will cross the 50 day SMA withing a week or so

-- Prices are above the 50 day SMA

-- Prices are in an uptrend

-- Prices are hitting upside resistance

-- As with the QQQQs, there is a lack of volume that is very disconcerting


On the SPYs, notice the following:

-- The 10 and 20 day SMA are moving higher

-- The 10 day SMA crossed over the 50 day SMA

-- The 20 day SMA will cross over the 50 day SMA within a week or so

-- Prices are higher than the SMAs

-- Prices are in an uptrend

-- There is also a lack of volume

So on the daily chart we have a lot of positive developments except a lack of volume. That means an overall lack of buying interest which is not encouraging.

Alan Greenspan -- WTF?!?!?!?!?!

From the Financial Times:

I am puzzled why the remarkably similar housing bubbles that emerged in more than two dozen countries between 2001 and 2006 are not seen to have a common cause. The dramatic fall in real long term interest rates statistically explains, and is the most likely major cause of, real estate capitalization rates that declined and converged across the globe. By 2006, long term interest rates for all developed and major developing economies declined to single digits, I believe for the first time ever.


That's right -- it happened everywhere so I'm not at fault. What a self-justifying idiot. This is like an alcoholic blaming a bartender for his problem.

Let's review the basic facts.

First, in the United States (where most US home buyers will get a loan), the Fed dropped interest rates to generational lows in the early 2000s. Here's a chart of the effective federal funds rate from the St. Louis Federal Reserve


At there rates, banks are basically paying people to take money. And take money they did. According to the Federal Reserve's Flow of Funds Report (PDF) total mortgage debt outstanding increased from $5.3 trillion in 2001 to $10.5 trillion in 2007. The number increased to $8.8 trillion in 2005.

For Greenspan -- who is a market based economist -- to now argue that the price of a good (here money) has no impact on its demand is the height of chutzpah.

Last Week's Market Action

Let's take a look at the charts to see what happened last week with the large averages.


The big move for the SPYs (and the other markets) happened on Tuesday when the market gapped higher and then continued moving. Wednesday through Friday was characterized by a simple give and take as the market consolidated gains from earlier in the week. The good news was the market didn't sell-off, indicating there is some confidence about the market right now. My guess is the Fed's backstopping the Bear deal and opening up the discount window to investment banks has given people confidence that we won't see a sudden bankruptcy in the financial markets.


The QQQQs and IWMs traded in the same pattern as the SPYs and need no other analysis.