Friday, August 8, 2008

Why is the Dollar Rallying?

Below is a chart of the dollar which is still rallying today. The question is, why?

Let's look at the reasons a currency rallies.

1.) The country's interest rates are increasing. Here is the money quote from the latest Fed statement:

Although downside risks to growth remain, the upside risks to inflation are also of significant concern to the Committee. The Committee will continue to monitor economic and financial developments and will act as needed to promote sustainable economic growth and price stability.


To me, this statement leans towards an increase. But, it doesn't say we're going to increase rates. Instead, it says the "upside risks to inflation are high." But also note the Fed has been saying for some time they expect commodity prices to decrease (which they are right now). So that might take some of the bite out of this statement.

So long as commodity prices continue to decrease or remain where they are for now, there is no reason from a policy perspective (price stability) of increasing rates.

2.) A growing economy. Do I have to lay this done again? The economy is in the early stages of a recession. If you don't see that then you're an idiot.

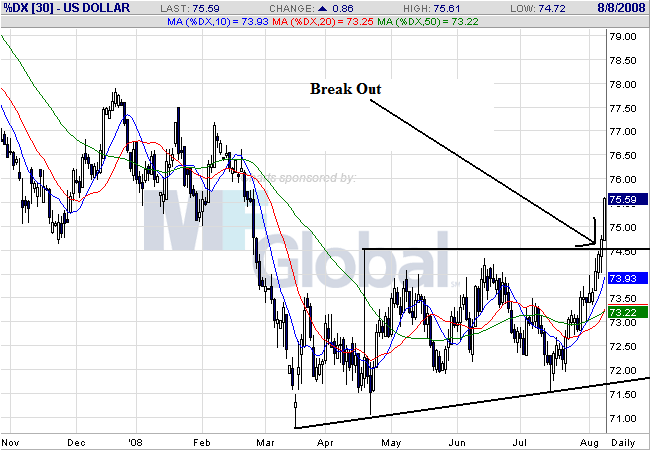
So -- the two primary fundamental reasons for a currency to increase are gone. That means there is a non-fundamental reason for the dollar's rally.

And indeed there is. There has been a fundamental change in the European interest rate outlook.

The euro fell the most in almost eight years against the dollar as traders pared bets the European Central Bank will raise interest rates as the economy slows.

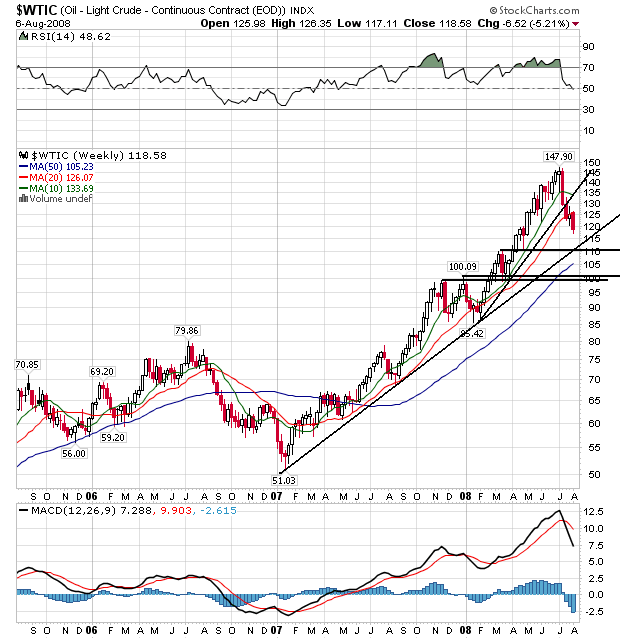
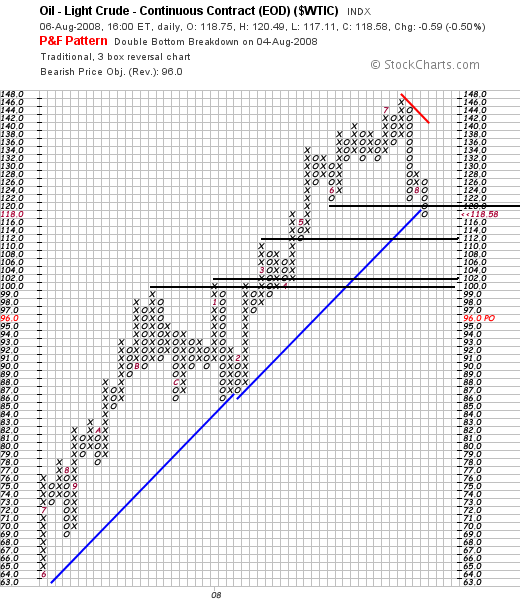
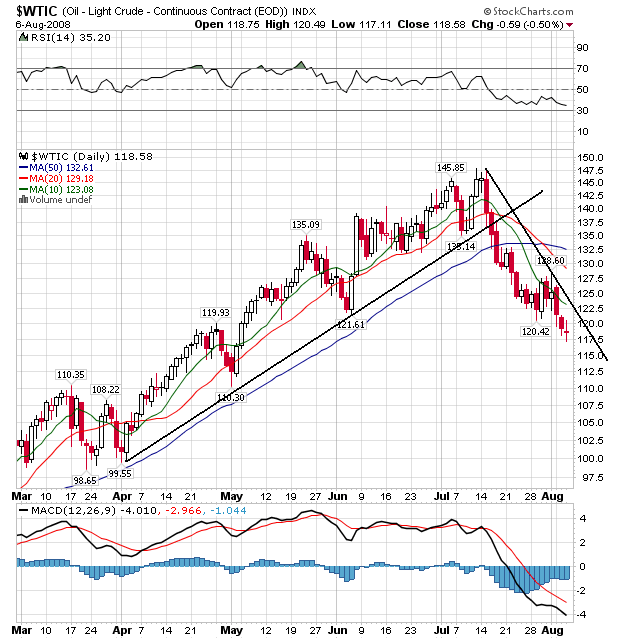
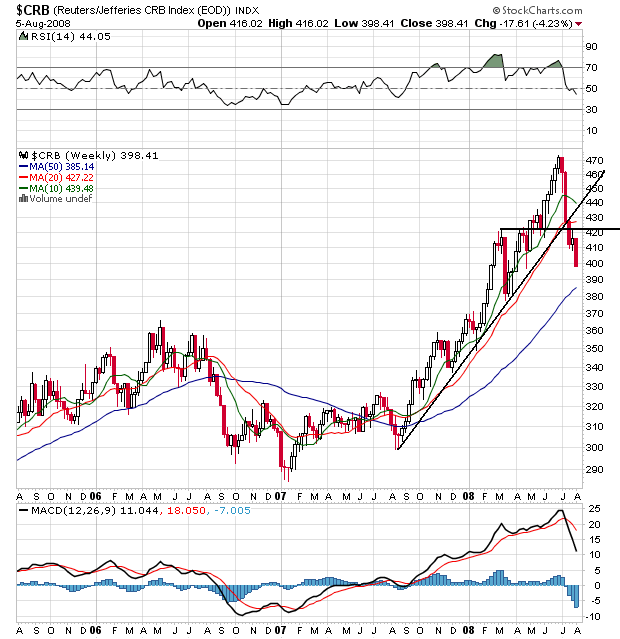
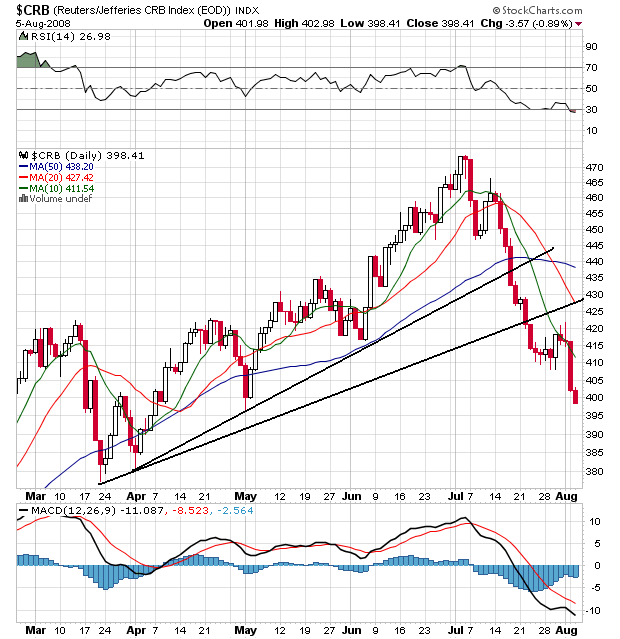
The euro is poised for its biggest weekly loss since January 2005 after ECB President Jean-Claude Trichet yesterday said economic growth will be ``particularly weak'' through the third quarter. An index that tracks the dollar against the currencies of six U.S. trading partners touched the highest since February. Crude oil fell to a three-month low, silver reached its cheapest since January and copper headed for its biggest weekly drop since March, easing inflation concerns.

``This is the beginning of a new chapter for the dollar as Trichet and other central banks are paying more attention to the downside risk to growth,'' said Dustin Reid, a senior currency strategist at ABN Amro Bank NV in Chicago. ``The decline of oil prices is a significant driver behind this dollar rally because it enables other central banks to turn their eyes away from inflation and focus on growth.''


In other words, there is nothing that has changed regarding the US economy or the Federal Reserve. There is a big change in the EU area. That means the dollar isn't increasing but the euro is falling. That's a big difference then a dollar rally.

We Didn't Do Anything Wrong -- Still...

From the WSJ:

Pushing to put one of the biggest debacles of the credit crisis behind them, Citigroup Inc. and Merrill Lynch & Co. agreed to buy back $17 billion in auction-rate securities.

The moves were aimed at defusing a regulatory and legal showdown about their sales practices for securities that were touted as safe but then couldn't easily be sold and in some cases lost value after the auction-rate market froze in February. The agreements also reflect Wall Street's growing determination to climb out of the morass left by a variety of soured securities, even if that comes at a steep cost.

Citigroup's settlement with the Securities and Exchange Commission and state regulators includes the repurchase of about $7.3 billion in auction-rate securities from about 40,000 individuals, charities and businesses with assets of less than $10 million. Citigroup also vowed to use its "best efforts" to help institutional investors sell roughly $12 billion of auction-rate securities they hold.

Several hours after the Citigroup deal was announced, Merrill Lynch said it would buy back an estimated $10 billion of auction-rate securities at full value -- but not until January. The one-year offer will apply to individuals, charities and small-business clients of Merrill.


Over the last few months, we've seen stories that at least 4 states (NY, MO and two others) and at least four firms (UBS, Wachovia, Merrill and Citi) were being targeted because of abusive/misleading sales tactics in the auction rate debt markets. Essentially, the firms continued to sell the bonds to investors (an recommend them strongly) even though the firms knew the market was collapsing.

The firms will issue a statement and the AG's will agree that "this is not an admission of guilt" (or some other such nonsense). But ask yourself this question: if they didn't do anything wrong why the quick settlement?

In addition, at a time when these firms are trying to unload bad debts they are now purchasing more bad debt they will have to unload in some way. That's not good for two institutions that are already really suffering from the credit crunch.

It also leads to this point: these firms clearly lied to investors to make a buck. How can we now trust them when they say, "we don't need to raise capital"?

In other words: the credit crunch isn't anywhere near over.

You Know Things Are Really Bad

When Paris Hilton makes sense:

See more Paris Hilton videos at Funny or Die


OK -- I usually stay away from politics on this site, but considering everyone in Washington is acting like a bunch of idiots, maybe we should listen to the celebrity who has a really good idea?

Forex Fridays -- the Dollar

Wow -- big week in dollar land

Photobucket

The dollar broke out of a trading range. The dollar has been meandering between 72 and 74 since May. This is a standard trading range which happens when traders are waiting for firm news to send the security in one direction or the other. This week we had news from central banks around the world.

The dollar was higher against most major currencies Thursday after the Bank of England and the European Central Bank decided to leave key interest rates unchanged.

The 15-nation euro slipped to $1.5328 in late New York trading, below the $1.5420 it bought late Wednesday. The pound was weaker at $1.9436, compared with $1.9475 the previous day.

The European Central Bank left its key interest rate unchanged at 4.25 percent Thursday, while the Bank of England kept interest rates steady at 5 percent for the fourth month running, as they both grapple with slowing economic growth as well as rising inflation.


In other words, this was less about the Fed's policy and more about the ECB keeping rates stable with the possibility of lowering later in the year because of slower growth.

Also on the daily chart, notice the following:

-- Prices are about all the SMAs

-- The shorter SMAs are starting to rise about the longer SMAs

This chart is starting to move into bullish territory.

Photobucket

On the longer (weekly chart) notice the following:

-- Prices have printed the strongest upward moving bar they have printed in a long time (as in years).

-- Prices have moved through all the SMAs

But

-- There is still a downward trend from the chart with the upside resistance.

Thursday, August 7, 2008

Today's Markets

Photobucket

The markets opened lower in a big way, and then moved lower touching the 200 minute SMA. Prices rallied from this level until they ran into resistance at the 20 minutes SMA before moving lower, again touching the 200 minute SMA a bit after 11 AM> Prices rose again, this time breaking through the 20 minutes SMA. But they couldn't maintain the momentum and they fell starting about 1PM. They took a big drop about an hour before the close, and then it was Katy bar the door.

Photobucket

On the 4 day chart notice that today's action took out about half of the Tuesday and Wednesday rally. Also note that prices fell below the 200 day SMA

Photobucket

On the daily chart, notice the following:

-- Prices are still in an uptrend.

-- Prices are above the 10 and 20 day SMA

-- The 10 and 20 day SMA are both heading higher, although at an extremely low angle.

-- Prices and SMAs are in an incredibly tight range right now, indicating a lack of direction.

Read This Now

Yes Virginia, there really is a recession going on.

And some great logic to boot.

The Detroit Death March

From the AP:

General Motors, Ford, Toyota and other automakers said Friday that their U.S. sales fell by double-digits. Nissan Motor Co. was the only major automaker to report a gain, with truck sales up 18 percent thanks in part to the new Rogue crossover and a boost in incentives. Nissan's overall sales rose 8.5 percent.

Automakers were expecting a slide in July as high gas prices continued to cut into sales of trucks and sport utility vehicles and new troubles in the auto leasing sector further wrecked consumers' confidence. July's seasonally adjusted sales rate -- which shows what sales would be if they continued at the same pace for the full year -- was 12.5 million vehicles, according to Autodata Corp. That's down from 17 million as recently as 2005.

Automakers expect things to get worse before they get better.


Again -- none of this should be a surprise. The US automakers are run by idiots. That means they will continue to make really stupid decisions for the foreseeable future.

Here's a really important question. Somewhere between $3.50/$4.00 gallon (on the national average) we hit an inflection point where prices started to negatively impact consumer behavior. Now that oil is coming down, will we see a reversion to previous behavior? Will consumers now want SUV's? Or have people permanently changed their attitudes? More importantly -- has Detroit permanently changed their ways where they are going to make more fuel efficient cars?

Only time will tell.

The Credit Crisis Isn't Anywhere Near Over

Every few weeks we get a new wave of "the bottom exists" in the financial shares happy talk. And then as if on cue, we get another wave of really bad news from the financial sector. Consider the following news we've seen this week so far.

From Marketwatch:

HSBC Holdings on Monday reported a 29% drop in first-half net income as bad-debt charges surged to more than $10 billion and write-downs continued to mount, though the banking giant increased its payout as profits in Europe and Latin America grew.

Loan-impairment charges and other provisions jumped 58% to $10 billion, with the majority of those bad-debt charges stemming from its U.S. business in personal financial services.

Overall, its North American operations reported a $2.89 billion pretax loss, compared to a profit of $2.4 billion in the first six months of 2007.


Loan impairment charges increased 58%. That is s huge increase. And the North American market is responsible for big losses. That means this segment of the world market isn't that great a place to be.

But here's the worst part:

HSBC, which bought U.S. lender Household International in 2003, is shrinking its U.S. mortgage book and said it will stop making new finance loans for vehicles.

The $13 billion vehicle-finance portfolio will be reduced by around 80% over three years, leaving the consumer-finance business mainly focused on credit cards and consumer loans.


At a time when the value of any of these bonds is highly questionable HSBC has to sell them. That's going to be murder on their bottom line until the process is complete. And then they get to time the best time in a bear market to sell these assets. Won't that be a whole lot of fun.

And then there is Freddie Mac:

Look past the devastating $821 million loss it reported for the quarter—nearly three times what Wall Street analysts had forecast. Ignore the $1 billion writedown the government-sponsored enterprise took on subprime and other risky mortgages, only the latest in a painful series. Disregard the rising rate of foreclosures, which grew 20% in the June quarter from the preceding quarter. Drill down to its fair value—a measure of the total worth of the assets on its balance sheet, minus its total liabilities. What do you see?

It looks an awful lot like a gaping hole. Freddie's fair value as of June 30 was a negative $5.6 billion. Based on this particular measure of its financial condition, if it had to sell its assets today, Freddie Mac would be worth less than nothing.


One of the largest players in the US mortgage market has a negative net worth. And they only wrote down $1 billion? Please. There is absolutely no way they only had $1 billion in losses on their mortgage portfolio -- not unless they were a whole lot smarter than everyone else in the mortgage market (and PS -- they weren't).

But, here's the news of the week that should indicate we're nowhere near bottom.

Mortgages issued in the first part of 2007 are going bad at a pace that far outstrips the 2006 vintage, suggesting that the blow to the financial system from U.S. housing woes will be deeper than many people earlier estimated.

An analysis prepared for The Wall Street Journal by the Federal Deposit Insurance Corp. shows that 0.91% of prime mortgages from 2007 were seriously delinquent after 12 months, meaning they were in foreclosure or at least 90 days past due. The equivalent figure for 2006 prime mortgages was just 0.33% after 12 months. The data reflect delinquencies as of April 30.

.....

Data on other classes of mortgages suggest the same trend. Freddie Mac reported Wednesday that 1.38% of the 2007-vintage loans it purchased were seriously delinquent after 18 months compared with 0.38% of 2006 loans at the same point in their life. Freddie Mac generally purchases loans made to creditworthy borrowers.

Last month, J.P. Morgan Chase & Co. said it expects losses on prime mortgages that weren't securitized and remain on its books to triple from current levels. The increase in bad loans is driven mostly by jumbo mortgages originated in the second half of 2007, a company spokesman said.

.....

Until these bad loans are fully digested, "foreclosures will remain at record highs, the financial system will be under severe stress and the broader economy will sputter," said Mark Zandi, chief economist of Moody's Economy.com. One piece of good news, he said, is that loans originated in the fourth quarter of 2007 and early 2008 appear to be performing better.


We're about 12-18 months into the 2007 vintage. This means we have at least another 12 months to go before we are through the initial problems of the portfolio. Until we are through these particular issues we can expect to hear about writedowns and the need to raise capital. That means the earliest we'll be out of the woods is next summer.

Thursday Oil Market Round-Up

Photobucket

On the weekly chart, notice the following:

-- The primary trend that started at the beginning of 2007 is still in place. Oil will have to drop below $115/bbl for that trend to break. In other words, the primary trend is still in place.

-- Prices have dropped below the 10 and 20 week SMA

-- The 10 and 20 week SMAs are turning neutral.

-- Prices have printed some incredibly strong downward bars over the last few weeks.

-- There is strong technical support in the %110 and $100 area. This support comes not only from previous price points, but the fact these are solid round numbers.

Photobucket

The P&F chart shows some other interesting developments.

-- The break of long-term P&F support

-- There is plenty of support at the $100/$102 level and some support in the $110/$112 area

Photobucket

On the daily chart, notice the following:

-- Prices are below all the SMAs

-- The 10 and 20 day SMA have moved below the 50 day SMA

-- All the SMAs -- including the 50 day SMA -- are now moving lower

-- Prices moved into the 10 day SMA and bounced back. In other words, the 10 day SMA is now resistance rather than support

Wednesday, August 6, 2008

Today's Markets


Let's go all the way back to Monday because the market has had a major rally since then.

On Monday, the market opened lower then went into an upward sloping channel before selling off at the end of the trading day

On Tuesday, the market gapped higher and then continued to rally for the entire day. Notice how the market used the 10 minutes SMA as technical support for the entire day. Also note how the market closed at the high of the day on strong volume. The main news on Tuesday was the FOMC meeting where the Fed kept rates neutral. This has led the market to thing the Fed will be on the sidelines for the foreseeable future. A lack of a rate increase means low rates for the foreseeable future.

The market opened a bit lower today and then retreated to the 50 minute SMA. Then prices recovered and continued moving sideways until 1PM. Prices bounced off the 50 minute SMA and continued to move higher. Notice the strong move higher and then the fall back to 20 minute SMA.

The market has moved higher by 3.46% since the close on Monday.

FOMC Statement

This is from the Federal Reserve's website:

Economic activity expanded in the second quarter, partly reflecting growth in consumer spending and exports. However, labor markets have softened further and financial markets remain under considerable stress. Tight credit conditions, the ongoing housing contraction, and elevated energy prices are likely to weigh on economic growth over the next few quarters. Over time, the substantial easing of monetary policy, combined with ongoing measures to foster market liquidity, should help to promote moderate economic growth.

Inflation has been high, spurred by the earlier increases in the prices of energy and some other commodities, and some indicators of inflation expectations have been elevated. The Committee expects inflation to moderate later this year and next year, but the inflation outlook remains highly uncertain.

Although downside risks to growth remain, the upside risks to inflation are also of significant concern to the Committee. The Committee will continue to monitor economic and financial developments and will act as needed to promote sustainable economic growth and price stability.


Let's take this one piece at a time.

Economic activity expanded in the second quarter, partly reflecting growth in consumer spending and exports.


From the BEA:

Real gross domestic product -- the output of goods and services produced by labor and property located in the United States -- increased at an annual rate of 1.9 percent in the second quarter of 2008 (that is, from the first quarter to the second quarter), according to advance estimates released by the Bureau of Economic Analysis. In the first quarter, real GDP increased 0.9 percent


So the economy limped along in the second quarter. Without the impact of the stimulus checks, the economy would have increased about 1.5%. So it's not great but not terrible.

However:

Real disposable income decreased 2.6 percent in June, in contrast to an increase of 5.2 percent in May. Real PCE decreased 0.2 percent, in contrast to an increase of 0.3 percent.


Real -- inflation adjusted -- spending decreased in June despite the impact of the stimulus checks. That does not bode well for the future. It indicates that even with a huge influx of money, consumers are pulling back from spending any money.

The Fed continued by noting:

However, labor markets have softened further and financial markets remain under considerable stress.


Year-over-year job losses continue:


And the unemployment rate is continuing to increase:


At the same time, the amount of asset-backed paper being issued is dropping, and


Short-term rates are still high.


Also note LIBOR is still above the Fed Funds rate, indicating a lack of liquidity.

The Fed continued:

Tight credit conditions, the ongoing housing contraction, and elevated energy prices are likely to weigh on economic growth over the next few quarters.


For tight credit conditions, see above.

Housing is nowhere bottom. The Case Shiller home price index is still dropping at record year over year rates. This indicates the market is nowhere near equilibrium.

The Fed continued:

elevated energy prices are likely to weigh on economic growth over the next few quarters


These is good news on this front. As noted in today's CRB post, commodity prices are starting to drop. Energy prices are included in this price drop. Should this continue, then a major pressure on the economy will be off. While we're not out of the woods yet, we're better off than we were a a few months ago.

The Fed continued:

Inflation has been high, spurred by the earlier increases in the prices of energy and some other commodities, and some indicators of inflation expectations have been elevated. The Committee expects inflation to moderate later this year and next year, but the inflation outlook remains highly uncertain


See today's post on the CRB. There may be good news on the inflation front over the next 12-18 months.

The Fed continued:

Although downside risks to growth remain, the upside risks to inflation are also of significant concern to the Committee. The Committee will continue to monitor economic and financial developments and will act as needed to promote sustainable economic growth and price stability.


In other words, the Fed isn't doing anything. There are still downside economic risks and upside inflationary risks. This is the equivalent of the economic perfect storm. The Fed is still between a rock and a hard place.

Wednesday Commodities Round-Up; CRB

I'm back. Edouard came and went. Frankly, it was really more of a day with a lot of rain and a bit of wind then anything else. I wanted to mention that our Mayor Bill White was great -- as usual. It's amazing what happens when people do their jobs well without a lot of fanfare. I wanted to thank all those who wished me well. That was also appreciated.

And now -- I present some charts of the CRB!


There's some extremely important news on this chart. The CRB was in a rally from the end of August of last year until the beginning of July this year. However, prices have since:

-- Broken the uptrend

-- Moved through price support established in March of this year

-- Moved through the 10 and 20 week SMA

-- Also note that prices have been using the 10 week SMA as technical support for the rally, yet have now moved below that level as well.

In other words, there have been some incredibly important technical developments on this chart that signal a change in direction.


On the daily chart, notice the following:

-- Price have broken through both upward sloping trend lines

-- Prices have moved below the 10, 20 and 50 day SMA

-- The 10 and 20 day SMAs are moving lower and have moved below the 50 day SMA

-- Last week prices ran into resistance at the 10 day SMA and couldn't move higher.

This is now a bearish chart.

Tuesday, August 5, 2008

Closed Today For Tropical Storm

I live in Houston, Texas. In about an hour the outer bands of Edouard will start to hit the city. I am expecting that we will lose electricity at some point.

The storm is supposed to move through the area by early tomorrow morning. I will be up and blogging again tomorrow.

Monday, August 4, 2008

Today's Markets


The markets opened to the downside on some pretty heavy down volume. They continued to move lower until a little before 11 AM when they popped on a heavy volume spile. They ran into upward resistance at the 50 minute SMA and then moved sideways eventually crossing the 50 minute SMA. Then they moved lower until about 1 PM. At this point there was another volume spike with upward action, but prices couldn't hold again. Prices sold-off until the end of the day, with two solid downward moves on volume spikes in the last 10 minutes.

Today's action was bearish, as prices could not hold on to any gains they made. Also note the end of the day sell-off, indicating traders were not willing to hold positions overnight.

What Inflation?

From CNBC:

Consumer spending, after adjusting for inflation, fell in June as shoppers were hit with the biggest increase in prices in nearly three decades.

The Commerce Department reported Monday that consumer spending dipped by 0.2 percent in June, after removing the effects of higher prices, the poorest showing since a similar drop in February.

The higher prices reflected a big surge in gasoline costs and helped to drive an inflation gauge tied to consumer spending up by 0.8 percent in June, the biggest increase since a 1 percent rise in February 1981.

The big rise in inflation ate up a part of the billions of dollars in stimulus payments delivered during the month. Personal incomes rose by a tiny 0.1 percent in June following a giant 1.8 percent increase in May.


So -- with the effect of the stimulus checks consumer spending decreased .2% thanks to the largest price increase since 1981. This is very bad news because it indicates consumer spending will drop hard when the rebate check effect wears off.

Housing is Nowthere Near a Bottom

From the NY Times:

The percentage of mortgages in arrears in the category of loans one rung above subprime, so-called alternative-A mortgages, quadrupled to 12 percent in April from a year earlier. Delinquencies among prime loans, which account for most of the $12 trillion market, doubled to 2.7 percent in that time.


Let's think about those figures for a minute. Alt-A loan arrears increased 4 times in a year. That's a huge pop. It indicates there are serious problems in that market from a variety of perspectives. For example, loose underwriting standards are combining with a weak job market, lagging wages and a lot of homes underwater to hit this are of the market hard.

But we're also seeing an increase in prime defaults -- which doubled over the year. There are people who have goo jobs and (probably) solid incomes. And they're having a problem getting their loans paid-off in increasing numbers.

This isn't over by a long-shot.

Market Monday's


The SPYs had a down/up set of days on Monday and Tuesday, with Tuesday essentially wiping out the losses of Monday. Tuesday also market the beginning of a two and a half day rally that sent the market higher by 4%. The market formed a triangle consolidation on Thursday and then fell at the beginning of the day on Friday before moving sideways for the remainder of the day.


On the daily chart, notice the following:

-- Prices are forming a triangle consolidation pattern right now.

-- The 10 and 20 day SMA are both moving sideways.

-- The 10 day SMA is over the 20 day SMA, but just barely.

-- Prices and the short-term SMAs are tightly bunched, indicating a lack of direction.

-- The 50 and 200 day SMA are both heading lower

This chart is short-term neutral because of the tight arrangement of prices and the SMAs and the neutral position of the SMAs and prices. However, the long-term position is negative with the 50 and 200 day SMA heading lower.