This is the second in a series of posts in which I will try to address the question, "When will the recovery add jobs?" In the first post, I looked at new jobless claims and suggested that they must fall to a level of at least 530,000 over a sustained period, or quickly under 500,000 to generate actual job growth. If jobless claims continue to decline at the slow trend of ~17,500/month, that would take another 3 months (at minimum).
In this post I will take a further look at the ISM manfuacturing index, which I have already noted correlates very strongly with job growth and loss, discussing two aspects in detail. As part of doing so, I will argue that the blogosphere overlooked perhaps the most important data in the Manpower hiring index from last week when they emphasized the part that said:
Employers' hiring plans for the upcoming fourth quarter dropped to their lowest level in the history of Manpower's Employment Outlook Survey, which started in 1962. .... Before this year, the survey's previous low point was a net 1% hiring outlook for the third quarter of 1982.
While the blogosphere correctly noted the extremely low levels of employers planning to hire, it failed to note that in the past, the manpower survey has actually lagged employment growth by one quarter, as employers tend to make plans for hiring in the coming quarter by projecting the last quarter into the future, as shown on this graph:

The first of two errors by the blogosphere is that it should have taken note that immediately subsequent to the record low hiring plans of 4Q 1982 came a hiring surge that began in January 1983, as employers quickly needed to catch up. I'll return to the second error later.
In a prior post, I noted that unlike previous recoveries in the 1992 and 2002 recoveries, the ISM manufacturing index never rose above 53.6, in contrast to earlier recoveries where it quickly rose above 55 or even 60. I have prepared a graph that confirms that indeed the level of 53 or above strongly correlates with the economy adding jobs Below that number the economy tends to shed jobs. In the graph, below, the low point for payrolls in each of the last 3 recessions (shown in red, green, and orange, respectively) is normed to 100. A reading of 103, for example, means 3 percent growth in payrolls from that low point. The ISM index is normed so that it crosses the 100 threshold at a reading of 53:
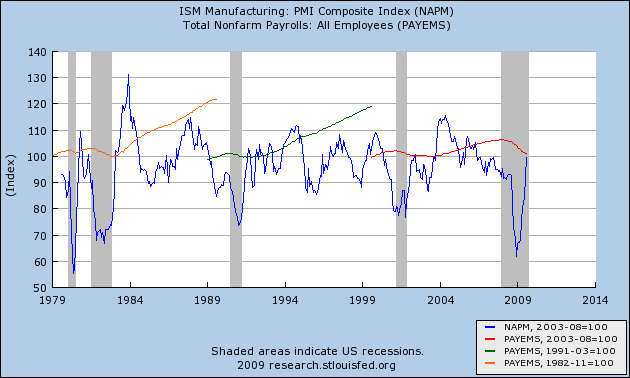
Note that the 53 level is the point where jobs began to be added in the very strong recovery after 1982, as well as during the week recoveries of 1992 and 2002. As of August, the index had surged to 52.9. Unless the index stalls out at the 53 level for several months, as it did in 2002, it suggests that job growth could begin as early as October, should there be two confirming readings above 53 in a row. Further, to date, a reading over 54 on the index has always coincided with actual job growth.
Another portion of the ISM index deals directly with employment. The employment index compares the percentage of employers planning to hire, lay off, or keep current staffing levels in the next month. A reading above 50 indicates net hiring, and visa versa for a reading below 50. Two items of data in this index stand out very clearly as harbingers of or absolutely coincident with employment growth. First, whenever the hiring vs. firing index is -5 or higher (i.e., no more than 5% more employers plan to fire than hire) and rising, where other evidence indicates a recession is ending, that has always indicated net employment growth was imminent, at least on a temproary basis.
Secondly, whenever current staffing intentions were 65+. and hiring plans were 15+, that has always coincided with positive jobs numbers in the BLS survey, including during and after the "jobless recoveries" of 1992 and 2002. Most typically as a recession ends, first fewer employers plan to lay employees off, and the number intending to keep current staffing levels rises - frequently past 65 to 70 percent. Next the percent intending to hire gradually rises even as the high percent of employers planning no change levels off or declines. In other words, employers tend to hoard plans to actually hire until they are sure that order growth is sustained, and during that interim an extraordinarily high percent will plan no changes. Here is a graph of the 2001 recession and the recovery afterward, showing this typical point:
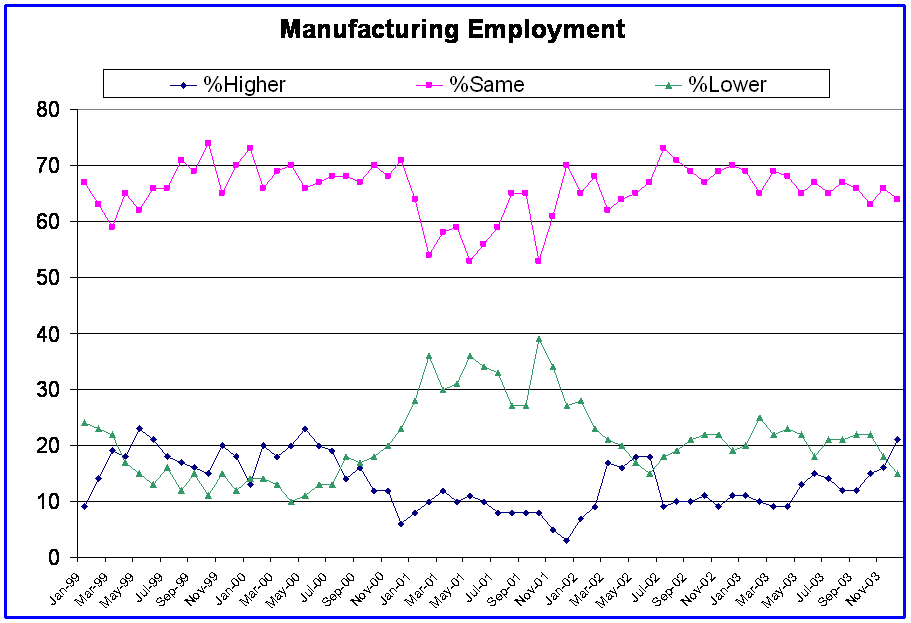
And here is the current graph:

We just reached the 70 percent no change level in July. In August that dropped to 69, but hiring intentions rose to 13. A shift of merely two percent would give us the 65+/15+ reading that has always coincided with employment growth in the past. The current reading of the index is -6, just one short of the -5 reading that has typically been a harbinger of growth. Again, unless the trend tops out here, job growth would appear to be very close.
And that brings us to the second way in which the blogosphere got the Manpower survey at least partly wrong last week: ignored in the blogosphere was the announcement that the number of employers planning no change in staffing levels reached an all time high:
There was one positive sign in the survey: 69% of employers said they planned no change in their hiring plans, up from 67% in the third quarter and 59% in the fourth quarter a year ago.
In other words, the manpower survey corresponds well to the ISM survey from July. Any unexpected increase in customer demand is going to force these employers to increase plans to hire from their extremely low levels.
In summary, the ISM manufacturing index information argues strongly that, IF present trends continue for even a couple more months, the economy will begin to add jobs.