Friday, February 20, 2009

Industrial Production Drops

From the Federal Reserve:

Industrial production fell 1.8 percent in January. At 101.3 percent of its 2002 average, output in January was 10.0 percent below its year-earlier level. Production in the manufacturing sector dropped 2.5 percent with broad-based declines among its components. A plunge in motor vehicle and parts production that resulted from extended plant shutdowns subtracted more than 1.0 percentage point from the change in manufacturing production. The output of mines moved down 1.3 percent. A swing to below-average temperatures contributed to an increase of 2.7 percent in the output of utilities. The capacity utilization rate for total industry fell to 72.0 percent, a rate 8.9 percentage points below its average from 1972 to 2008.

.....

In January, manufacturing output fell 2.5 percent and was 12.9 percent below its year-earlier level. The factory operating rate moved down 1.7 percentage points, to 68.0 percent, the lowest rate of utilization since this series began in 1948. The index for durable goods dropped 4.8 percent. The output of motor vehicles and parts decreased at a monthly rate of 23.4 percent in January, after having contracted at an annual rate of more than 37 percent in the fourth quarter. All of the remaining major indexes fell sharply in January with the exception of miscellaneous manufacturing, which moved up 0.3 percent. The production of nondurable goods decreased 0.5 percent. The output of food, beverage, and tobacco products rose 0.6 percent after having fallen more than 2 percent in December, but declines were recorded in all the other major nondurable goods industries.

The index for the other manufacturing category, which consists of publishing and logging, decreased 1.5 percent.


There is no good news in this report. Period.

Import, Producer and Consumer Price Round-Up

From the BLS:

Import prices fell 1.1 percent in January and 23.4 percent over the past six months. For the sixth consecutive month, petroleum prices and nonpetroleum prices decreased, falling 2.4 percent and 0.8 percent, respectively, in January. However, prices for both overall imports and petroleum decreased at a smaller rate in January than in each of the previous five months since prices last rose in July. Petroleum prices fell 69.1 percent over the past six months and 55.0 percent over the past year, the largest 12-month decline since the index was first published in June 1982. Overall, import prices fell 12.5 percent for the year ended in January, the largest 12-month decline since the index was first published in September 1982. Nonpetroleum prices decreased 5.7 percent over the past six months and 0.6 percent over the past year.

The 0.8 percent January decrease in nonpetroleum prices was led by a 4.8 percent drop in the price index for nonpetroleum industrial supplies and materials. Falling prices for chemicals and natural gas were the largest contributors to the decline. Nonpetroleum industrial supplies and materials prices decreased 7.6 percent over the past year, led primarily by declining unfinished metals prices.

In contrast, prices for automotive vehicles increased in January, rising 0.2 percent after decreasing the previous two months. For the year ended in January, the index increased 0.7 percent.

The price indexes for consumer goods, capital goods, and foods, feeds, and beverages were unchanged in January. Over the past year, consumer goods prices increased 1.5 percent, capital goods prices advanced 0.9 percent, and prices for foods, feeds, and beverages rose 3.3 percent.


Looking at the BLS' end use tables we see drops in industrial supplies and goods but increases in capital goods, autos and consumer goods. However, all imports excluding fuels and all imports excluding petroleum have been decreasing for the last four months.

Non-manufactured articles dropped 45.9% year over year.

Manufactured articles dropped 3.7% year over year.

Here's the chart from Econoday:


From the BLS:

The Producer Price Index for Finished Goods rose 0.8 percent in January, seasonally adjusted, the Bureau of Labor Statistics of the U.S. Department of Labor reported today. This increase followed declines of 1.9 percent in December and 2.5 percent in November. At the earlier stages of processing, the decrease in prices for intermediate materials slowed to 0.7 percent from 4.2 percent in the prior month, and the index for crude materials declined 2.9 percent after dropping 5.3 percent in December.


What makes this news less scary is that core PPI has been increasing for the last five months when we've been seeing large decreases in the overall PPI. However, core prices of intermediate goods have been decreasing for the last four months and core prices of crude goods decreased throughout the fourth quarter of 2008 while ticking up slightly last month. In other words, there could be downward pressure on prices over the next few months.

Here are the relevant charts from Econoday:


From the BLS:

The Consumer Price Index for All Urban Consumers (CPI-U) increased 0.4 percent in January, before seasonal adjustment, the Bureau of Labor Statistics of the U.S. Department of Labor reported today. The January level of 211.143 (1982-84=100) was virtually unchanged from January 2008.


The good news here is core prices are still positive for the last 8 months. This tells us that price drops are occurring in the food/energy area rather than overall. A big reason for the drop in CPI over the last half of 2008 was transportation costs. Here is a chart of gas prices from that period:


In addition, although agricultural prices have dropped over the same period:


They have remained positive in the CPI numbers over the last half of 2008.

Forex Fridays

Click on all images for a larger picture.


On the weekly chart, the dollar has moved above the triangle consolidation of the last month and is approaching the previous highs established in the fourth quarter of last year. Prices are still above all the SMAs. All the SMAs are also moving higher, although the 10 week SMA is below the 20 week SMA. Also note the MACD is about to give a buy signal with the cross over and the RSI is rising indicating prices are getting stronger. On this chart the main issue going forward is whether or not prices will moved beyond the highs established in the fourth quarter.


The daily chart shows prices have been in an uptrend for two months. They consolidated in a triangle formation for the last few weeks but are once again moving higher. Also note the MACD is rising as is the RSI. The main issue for this chart -- as with the weekly chart -- is whether the dollar will successfully move through the previous high.

Thursday, February 19, 2009

Today's Markets

Click for a larger image


On the daily chart, simply notice that prices are below all the relevant trend lines from the two month consolidation pattern of the last two months. Also note that today's volume total is pretty weak compared to the past few days.


On the 5 minute chart, notice the following:

-- Prices have been in a fairly narrow range for the last three days. However

-- Prices gapped higher at the open only to fall throughout the day. Also note that prices closed near session lows on increasing volume, indicating the selling momentum was increasing throughout the trading day.

Translating "Fed-Speak"

Yesterday the Fed released the minutes of its latest meeting. I love these types of reports because they show us what the Federal Reserve is seeing. Therefore, it gives us an idea for what they are thinking.

This will be a long post.

Employment continued to contract. Private nonfarm payrolls fell sharply in December, with substantial losses over a wide range of industries. Indicators of job vacancies and hiring declined further, and layoffs continued to mount. The unemployment rate increased to 7.2 percent in December, the share of individuals working part time for economic reasons surged, and the labor force participation rate edged down for a second consecutive month.


Above is a chart of the year over year percentage change in total payrolls. Notice the latest percent change is now lower than the 1990s and 2001 recession. We're in 1982 territory -- a particularly nasty recession. I wrote a longer article on the jobs market after the latest BLS report which has a longer list of data points.

In December, industrial production posted a sharp decline after falling substantially in November; the contraction was broad-based. The decrease in production of consumer goods reflected cutbacks in motor vehicle assemblies as well as in the output of consumer durable goods such as appliances, furniture, and carpeting. Output in high-tech sectors contracted in the fourth quarter, reflecting reduced production of semiconductors, communications equipment, and computers. The production of aircraft and parts recorded an increase in December after being held down in the autumn by a strike and by problems with some outsourced components. Available forward-looking indicators pointed to a further contraction in manufacturing output in coming months.


Capacity utilization -- the amount of our industrial capabilities that we use -- is near the lows of the 1982 recession. Also note it


Durable manufacturing is falling off a cliff as well. It's rate of decline is that of the mid-1970s contraction.


The rate of decline of non-durable manufacturing is also are mid-1970s levels.

Real consumer spending appeared to decline sharply again in the fourth quarter, likely reflecting the combined effects of decreases in house and equity prices, a weakening labor market, and tight credit conditions. Real spending on goods excluding motor vehicles was estimated to have fallen noticeably in December, more than reversing an increase in November. Outlays on motor vehicles edged down in November and December following a sharper decline in October. Early indicators of spending in January pointed to continued soft demand. Readings on consumer sentiment remained at very low levels by historical standards through the end of 2008 and showed little improvement in early January.


Real (inflation-adjusted) expenditures are near record lows for the year over year percentage change as well. This figure includes retail sales, which are also abysmal


Single-family housing starts dropped at a much faster rate in those months than they had in the first 10 months of the year. Multifamily starts also fell in those months, as did permit issuance for both categories. Housing demand remained very weak and, although the stock of unsold new single-family homes continued to move down in November, inventories of unsold homes remained elevated relative to the pace of sales. Sales of existing single-family homes dropped less than sales of new homes in November and turned up in December, but the relative strength in sales of existing homes appeared to be at least partly attributable to increases in foreclosure-related and other distressed sales. Although the interest rate on conforming 30-year fixed-rate mortgages declined markedly over the intermeeting period, the Senior Loan Officer Opinion Survey on Bank Lending Practices that was conducted in January indicated that banks had tightened lending standards on prime mortgage loans over the preceding three months. The market for nonconforming loans remained severely impaired. Several indexes indicated that house prices continued to decline rapidly.


The housing market is still a mess (thanks to Calculated Risk for the images)


The months of supply at the existing sales pace is still high. Again, the drop is probably temporary for the reasons cited above.


New home sales continue to drop -- there has been no attempt on the graph to slow the fall.


While the total inventory has been dropping (which is good)


The months of available inventory is still increasing because of the continual drop in sales.

As a result of all this:


Prices are still dropping. Note how far about the standard median of the 1990s prices still are. In other words, we probably have a long way to go.

In the business sector, investment in equipment and software appeared to contract noticeably in the fourth quarter, with decreases registered in all major spending categories. In December, business purchases of autos and trucks moved down. Spending on high-tech capital goods appeared to decline in the fourth quarter. Orders and shipments for many types of equipment declined in October and November, and imports of capital goods dropped back in those months. Forward-looking indicators of investment in equipment and software pointed to likely further declines. Construction spending related to petroleum refining and power generation and distribution continued to increase briskly in the second half of 2008, responding to the surge in energy prices in the first half of that year, but real investment for many types of buildings stagnated or declined. Vacancy rates for office, retail, and industrial properties continued to move up in the fourth quarter, and the results of the January Senior Loan Officer Opinion Survey indicated that financing for new projects had become even more difficult to acquire.


Photobucket

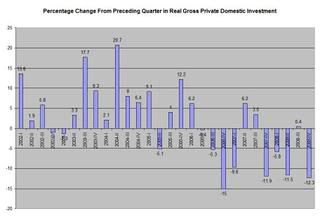
Net investment has decreased in 8 o the last 11 quarters. In addition, note that investment barely increased in one of those quarters.

Here's the bottom line: it's terrible out there.

Thursday Oil Market Roundup

Click on all pictures for a larger image


The weekly chart hasn't changed in some time. Prices are still consolidating in a triangle, while the MACD is oversold and the RSI indicates prices are weak. The price/SMA picture is still bearish: the shorter SMAs are below the longer SMAs, all the SMAs are moving lower and prices are using th 10 week SMA as upside technical resistance.


The daily chart points to consolidation. Prices have been in a triablge consolidation pattern for the last few months and prices and the SMAs are in a tight range. However, note the MACD is is maxed out -- meaning, it hasn't moved higher in some time. This implies there is a possibility of prices moving lower right now.

Bottom line: the technical picture is one of an oversold market. But the fundamental backdrop is driving prices right now: the economy is weak implying demand will be low for some time and inventories are still increasing:

Wednesday, February 18, 2009

Today's Markets


The good news is the market didn't fall farther today -- that's about it. Notice prices are still below whichever trend line you use.


On the 5 minute chart, today was a day when we moved a bit here and there but when there wasn't much of a move anywhere. I would call it a consolidation day.

Wherein I May Eat Crow

The Issue on nationalizing the banks is once again on the front page as Greenespan (of all people) is backing limited nationalization:

The US government may have to nationalise some banks on a temporary basis to fix the financial system and restore the flow of credit, Alan Greenspan, the former Federal Reserve chairman, has told the Financial Times.

In an interview, Mr Greenspan, who for decades was regarded as the high priest of laisser-faire capitalism, said nationalisation could be the least bad option left for policymakers.

”It may be necessary to temporarily nationalise some banks in order to facilitate a swift and orderly restructuring,” he said. “I understand that once in a hundred years this is what you do.”

Mr Greenspan’s comments capped a frenetic day in which policymakers across the political spectrum appeared to be moving towards accepting some form of bank nationalisation.

“We should be focusing on what works,” Lindsey Graham, a Republican senator from South Carolina, told the FT. “We cannot keep pouring good money after bad.” He added, “If nationalisation is what works, then we should do it.”

Speaking to the FT ahead of a speech to the Economic Club of New York on Tuesday, Mr Greenspan said that “in some cases, the least bad solution is for the government to take temporary control” of troubled banks either through the Federal Deposit Insurance Corporation or some other mechanism.

The former Fed chairman said temporary government ownership would ”allow the government to transfer toxic assets to a bad bank without the problem of how to price them.”


I originally came out against nationalization. I wrote about the problems in detail in this article. However, here is the central thrust of my concerns:

In addition, we now have the same problem involved with all processes involving politicians -- undue influence. Within five years I am betting all of the following will happen:

1.) A person in government (elected or not) leans on a bank to make a sweetheart loan to someone/an entity/a group not qualified to take out the loan

2.) A major campaign contributor gets a sweetheart "consulting" contract to service a financial institution.

3.) A major campaign contributor gets a special loan package

4.) The issue of patronage enters the picture: campaign workers/politically connected people who are unqualified to work in the financial field or are minimally qualified get jobs in the financial field

5.) A bank that shouldn't have qualified for government assistance gets government assistance. Actually - that's already happened:

Troubled OneUnited Bank in Boston didn't look much like a candidate for aid from the Treasury Department's bank bailout fund last fall.


The Treasury had said it would give money only to healthy banks, to jump-start lending. But OneUnited had seen most of its capital evaporate.


Moreover, it was under attack from its regulators for allegations of poor lending practices and executive-pay abuses, including owning a Porsche for its executives' use.


Nonetheless, in December OneUnited got a $12 million injection from the Treasury's Troubled Asset Relief Program, or TARP. One apparent factor: the intercession of Rep. Barney Frank, the powerful head of the House Financial Services Committee.


Mr. Frank, by his own account, wrote into the TARP bill a provision specifically aimed at helping this particular home-state bank. And later, he acknowledges, he spoke to regulators urging thatOneUnited be considered for a cash injection.


.....


On Dec. 3, Rep. Spencer Bachus (R., Ala.) forwarded a Dec. 2 letter from Alabama bank regulators complaining about the complexities of applying for federal funds. Alabama banks later received billions in funds.


6.) Less than 50% of the banks return to profitability.

7.) Of the remaining 50%, none of them achieve better than 80% of the previous institutional high of ROE. In other words -- the previous management made more money for shareholders

8.) Lending does not increase to pre-meltdown levels -- or to acceptable levels.


In short, my concerns were primarily that we would trade one form of stupidity, ignorance and gross incompetence for another form of stupidity, ignorance and gross incompetence.

However, I am left with a dilemma: what in the hell are we going to do to solve the problem? Simply put, I cannot find any answer that I like to any of these questions. Which leaves nationalization on the table. That does not mean I like the idea. In addition, I am still deeply concerned about the possibility of all the above scenarios happening in some way. And -- I should add -- I am not saying we need to nationalize (largely because I am an incredibly stubborn pain about such things). But I am also thinking it's back on the table if for no other option then there aren't many other options out there.

OECD Economies Shrink Most on Record

From Bloomberg:

The economy of the member states of the Organization for Economic Cooperation and Development contracted the most on record in the fourth quarter as the global crisis hit investments and consumption.

Gross domestic product in the OECD area fell 1.5 percent from the previous three months, the largest decline since the series began in 1960, the Paris-based organization said in an e- mailed statement today. GDP contracted 0.2 percent in the third quarter from the second.

With consumers and companies unable to secure credit for purchases and investments, sales of cars and machinery are declining, forcing producers across the globe to reduce their workforces.

Wednesday Commodities Round-Up

Click on all images for a larger image


Soybeans have tumbled in a big way. Notice that from their highs of last summer prices have dropped by about half. Also note the declining RSI indicating prices are continually weaker and the declining MACD indicating declining momentum. The SMA picture is weak as well. The 20 and 50 week SMAs are both moving lower. While the 10 week SMA has recently moved through the 20 week SMA, prices have dropped below all the SMAs indicating further weakness is ahead.


Gold has re-attained its safe have nluster. Note on the price chart that prices broke through the upper trend line of a consolidation pattern. This indicates buyer enthusiasm. Also note the rising MACD and RSI, indicating stronger moemntum and stronger prices. The SMA picture is interesting. First -- prices are above all the SMAs indicating all the SMAs will continue to move higher. The 10 week SMA just crossed the 50 week SMA while the 20 week SMA is still below the 50. In other words, we've got a ways to go before the SMAs line up into an extremely bullish alignment. Given the global uncertainty right now, gold may be the primary bull market going forward.

Tuesday, February 17, 2009

Today's Markets

It's days like this that make me think the market just doesn't like me.


No matter which lower trend line you are using prices today went through all of them on solid volume. That means the probability of testing the lows from the end of last year just increased in a big way.


On the daily chart, notice that prices just died at the opening and stayed there all day long. Prices also closed at or near their low point of the day on solid volume. so much for the market moving higher with the mortgage plan, huh?

Empire State Still Terrible

From the NY Fed:

The Empire State Manufacturing Survey indicates that conditions for New York manufacturers deteriorated significantly in February. The general business conditions index fell to a new low of -34.7. The new orders index also fell to a new low, the unfilled orders index stayed close to its recent record low, and the shipments index—despite a slight improvement—remained negative. The indexes for both prices paid and prices received held below zero, with the latter dropping sharply. Employment indexes remained deep in negative territory; the average workweek index slipped to a record low. The future general business conditions index was negative for a second consecutive month as many of the forward-looking indexes remained close to recent lows. The future index for number of employees fell particularly sharply, eclipsing last month’s record low.


Let's break this down.

General business conditions: new low

New orders index: new low

Unfilled orders index: close to its record low

Prices received: dropped sharply (as in deflation)

Here is a relevant chart of the overall conditions:


Click for a larger image. The Gray lines are from the Empire State Survey.

Here are some more charts from the report:


Let's take a look at some charts from prophet.net to see what various sectors are looking like right now:


Overall manufacturing is in a terrible way. Prices are below all the SMAs, the shorter SMAs have crossed below the longer SMAs and prices have run into upside resistance at the SMAs. Also note the heavy volume sell-off that started in the third quarter of last year.


Again, note that prices are near five year lows with the 10 and 20 month SMAs moving lower. Also note the heavy volume that started at the end of the second quarter/beginning of the third quarter.


In the industrial equipment sector, prices are below all the SMAs and the 10 and 20 week SMA are dropping. Also note the heavy sell-off volume at the beginning of the third quarter.


On the industrial equipment/component sector, all the SMAs are moving lower while the 10 month SMA is acting as upside resistance.


On the farm equiment chart note the extremely heavy selling that has been occurring over the last two quarters. Also note the 10 month SMA privided upside resistance to a recent rally


Diversified machinery is in the same boat as all the other sectors -- low prices, heavy volume and upside resistance from the SMAs.

What Got Us Into This Mess

The following is from a Barron's interview with Robert Albertson

Barron's: In 2006, you wrote that the consensus economic view was way too optimistic. What concerned you?

Albertson: There were three key trends that had been growing over the years. The first was that there was a complete reversal of global monetary flows. We had never had the emerging markets running the show on liquidity, and it became huge.

Do you mean in terms of emerging-market governments buying Treasuries and basically funding a lot of borrowing in the U.S?

That is right, essentially. So it dawned on me that the Fed[eral Reserve] no longer really had control. But more importantly, the money flows were distorting interest rates to the low side -- ridiculously so. Then, starting in 2003, the Fed compounded the problems by driving rates even lower.

What were the other themes that alarmed you?

The assumptions on home prices in the United States and elsewhere were clearly decoupling from any kind of reality. And third -- and I didn't notice this until about 2004 -- the consumer in America didn't go through a recession in 2000; we had a half-recession, if you will. So [consumers] continued to spend.

I looked at those three themes together, and I thought there was too much liquidity in the system, and that it was going to come back to haunt us.


Let's take these one at a time.

The first is what Ben Bernanke calls the Global Savings Glut. Essentially, less developed countries became net exporters while the industrialized world (the US and Europe) became net importers. When this happened -- especially from the US perspective -- dollars flowed outwards to the developing countries. This is how China and the Middle East were able to develop sovereign wealth funds. This money has to go somewhere. As a result, there was a lot of money sloshing around the world. Excess supply = decreased price = cheap money for an extended period of time. Add easy Al Greenspan on top of that and you have a world of trouble.

As for home prices, consider these charts from the blog Risk and Return


Click for a larger image

Remember -- markets eventually seek equilibrium. In other words, US home prices were way out of whack. This also implies we're nowhere near a bottom in housing.

And finally there is the US consumer.


Click for a large image

The US never stopped shopping. That means the US consumer needed to continually find new sources of money which means two things:


Household debt exploded and


Savings decreased.

Now we get to retrench. That means we don't spend as much and save more. Which is great in the long run. But now we need a vibrant consumer willing to open his wallet -- and he's not going to be there like before. Notice the big bump up in the savings rate. People are now savings more than before.

In short, the US has to rethink it's economy right now. We're probably going to move from a high consumption model to a lower consumption more production model. That also means the transition will take longer during which our overall growth rate will be lower.

Treasury Tuesdays


Click for a larger image

Notice the following on the IEF (7-10 year Treasury) chart:

-- Prices have been in a clear downtrend since the end of last year

-- All the SMAs are moving lower

-- The shorter SMAs are below the longer SMAs

-- Prices have been using the 10 and 20 day SMA as upside resistance for the last two months

-- Price have rallied to two key Fibonacci levels and then fallen back

Then there is the fundamental picture:

Time and again the U.S. Treasurys market has escaped the correction many believe is inevitable for a market that is so buoyant, it could be mistaken for a bubble. This week, it may not be so fortunate.

Prices of government bonds started to fall Friday, ahead of the vote by the House of Representatives that approved the nearly $800 billion stimulus package. This decline could be the beginning of the capitulation the market has been bracing for since the administration of President Barack Obama took over, with promises of a recession-era boom in government spending.

No sooner had lawmakers reached a compromise on this spending program than yet another began to take shape, this time to help homeowners avoid default on their mortgages. Though the dimensions of this package are unclear -- details are expected Wednesday -- the bottom line is unequivocal. Each new rescue plan signals an expansion of government borrowing and more bonds flooding the market, which absorbed a record $67 billion last week.

It may seem a wonder that Treasurys prices have held up so well against this onslaught. Last week's auctions of three-year, 10-year and 30-year paper proved that investor demand for supposedly risk-free U.S. securities remains an easy match for the government's funding needs.

Particularly surprising for some was the frank display of foreign investor appetite. Indirect bids, widely cited as a measure of offshore demand, were well above average for each, ranging from 34% for the 30-year to almost 45% for the short bond.

Those expecting a reversal of bond prices had reckoned without the financial markets' harsh verdict on the latest program to aid banks. Treasury Secretary Timothy Geithner's Financial Stability Plan was too short on detail to convince investors that a recovery for the sector is at hand. Sharp declines on stock indexes contributed to the rush to safer positions in Treasurys.

Friday's trade wiped out those gains in the 30-year bond, which was sold in large volumes by mortgage originators as part of energetic hedging activity ahead of the three-day Presidents Day weekend.


There is a ton of supply coming to market right now.

Monday, February 16, 2009

Back in the Morning

The markets are closed today so there won't be a market wrap. I'll be back in the morning with Tuesday's Treasury market Round-Up.

Japan's GDP is Crashing

From the NY Times:

Japan's economy contracted at the fastest pace in 35 years in the fourth quarter as a collapse in export demand drained life from the world's second-biggest economy.

Japan's gross domestic product, or the total value of the nation's goods and services, dropped at an annual pace of 12.7 percent in the October-December period, the government said Monday.

That's the steepest drop for Japan since the oil shock of 1974 and far outpaces declines of 3.8 percent in the U.S. and 1.2 percent in the euro zone. A survey of economists by Kyodo news agency had projected an 11.6 percent contraction.

Japan now faces ''the worst economic crisis in the postwar era,'' said Economy Minister Kaoru Yosano, according to Kyodo.


Let's place this number in perspective. There is no "formal" definition of depression. However, consider the following:

There is no widely-agreed-upon definition for a depression, though some have been proposed. In the United States the National Bureau of Economic Research determines contractions and expansions in the business cycle, but does not declare depressions.[1]

A proposed definition for depression is a sustained recessionary period in which the population is forced to dispose of tangible assets to fund every day living, as was seen in the US and in Germany in the 1930s.

Often, in Canada and the United States, the word "depression" is used interchangeably with "recession", often to simply indicate a deeper or more serious recession. Some economists require a fall in GDP of 10 per cent or more before a recession would be referred to as a depression


From a purchasing power parity perspective, Japan is the third largest economy in the world

I have nothing more to add.

Market Monday's

Click on all images for a larger image


On the daily chart, notice that prices dropped last week and are right at the lower end of the recent trading range. Also note that prices are below all the SMAs, but that the SMA picture is extremely cloudy right now.


The 5-minute chart offers a ton of interesting technical information. First, notice trading from Wednesday through Friday created an upside down head and shoulders pattern. In addition, note that each shoulder of the H&S pattern is a triangle and the head is a double bottom.

All of this implies we're moving higher this week. In addition, remember that prices are at the lower end of the trading range. Finally, we're supposed to get a mortgage rescue package sometime this week (Wednesday I believe) which could bolster the markets.