Friday, August 28, 2009

Weekend Weimar and Beagle

It's that time of the week. Go be with your families and loved ones.

See you on Monday.


TARP Making Money So Far

There are a few basic points that seem to get lost in the TARP debate. The first is these are actually preferred shares that pay interest:


Click for a larger image.

And so far, the government is showing a profit:

The actual returns to the Treasury from dividends banks pay on preferred shares issued through the program, in addition to the returns generated through warrant redemptions thus far, have been impressive. In fact, the total rate of return to the Treasury for all companies that have repaid TARP funds and redeemed their warrants associated with the program has been 10.22%, according to SNL data. The warrant redemptions have accounted for a large portion of that return, bringing in a 7.21% return to the Treasury. When looking at the return to the Treasury on an annualized basis, it becomes even larger, yielding 12.74% to the government on the 21 banks that cashed it out in full.

.....

The largest total returns to the Treasury have come from some of the largest recipients of TARP funds, namely Goldman Sachs Group Inc., Morgan Stanley and American Express Co., whose dividends on the government's preferred shares and the redemption of warrants tied to the program yielded returns to Uncle Sam of 14.18%, 12.68% and 12.23%, respectively, according to SNL data.

Here is a chart of the returns the government received from various institutions:

Consumer Expectations Improve

- by New Deal democrat

The final August University of Michigan index of consumer sentiment was reported this morning. It had been causing me concern as during July and earlier this month, both the current conditions and the future expectations components were decreasing. The expectations component is a Leading Economic Indicator, and was the only such indicator decreasing. Added to job declines and wage stagnation, and there was great cause for concern.

Not only did the overall index improve from 63.2 earlier this month to 65.7 (but still below July's 66.0 and June's 70.8), but the expectations index, which was 62.1 earlier this month, improved to 65.0, exceeding July's 63.2 reading (although still below May's high of 69.4).

Not perfect, but back on the right track. This means that it will make a positive contribution to August's tally of LEI's, which look on track for another strong month -- the fifth in a row.

FDIC Problem List Grows

Yesterday the FDIC released the quarterly banking profile. The report indicated the industry is still very sick.

The Federal Deposit Insurance Corp. said it had 416 banks on its "problem list" at the end of June, equivalent to about 5% of the nation's banks, up from 305 at the end of March and 117 at the end of June 2008. Problem banks had a combined $299.8 billion of assets at the end of June, compared with $78.3 billion a year ago.

Landing on the FDIC's problem list means a bank is at a high risk of insolvency. State and federal regulators have already shut 81 banks this year.

"It's a continuation of the deterioration across the industry," said Gerard Cassidy, a bank analyst with RBC Capital Markets. "We think there are hundreds of failures to come."


There are a few points to make about this data.

The total amount of assets on the problem list is $300 billion. This is not good, but it is not terrible either; the asset size is manageable. In addition, that assumes a 100% failure rate of the banks which is doubtful. In addition, consider this chart from Calculated Risk:

In short, we've been through far worse times when far more assets were a problem.

In addition,

The swelling of the problem list could be a harbinger of further industry consolidation, analysts said. Large, healthy banks, several of which have paid back their government-rescue funds, are "chomping at the bit" to buy failed lenders from the FDIC, and Thursday's report is likely to further whet their appetites, said Ed Najarian, head of bank research at International Strategy & Investment Group Inc. "They're looking at it as more opportunity to acquire banks."


We've seen the FDIC and government regulators do a lot of shotgun weddings in the banking industry. My guess is there are alot of phone calls going on right now to see who wants to acquire what bank.

The primary problem this situation creates is a decrease in lending as the economy moves forward. In actuality from the consumer's perspective this development couldn't happen at a better time as consumer loan demand is dropping. From the commercial side it's an issue and will probably hinder growth.

All this being said, this is a bad development. But so far it is a manageable disaster -- that is, between industry consolidation, an increase in loan loss reserves and the total amount of assets under pressure this situation can be dealt with. However, that could change it the situation continues to deteriorate.

Today's Market


Click for a larger image

Fascinating market yesterday. The market sold off in the morning but then rallied for the rest of the day. Notice how starting at about 11 the market simply turned around and went into a solid day long rally.


Looking at the 5 day chart, we see a trading range, which is is more than apparent on the daily chart:


Sideways prices are the best thing for bulls right now. It allows the buying frenzy to cool off without denting profitable positions.

Forex Fridays

The weekly chart shows a clear downtrend. The MACD is moving lower along with the RSI. Prices have been and continue to be in a downtrend. All the EMAs are moving lower, the shorter EMAs are below the longer EMAs and prices are below all the EMAs.


The daily chart is a far harder read. There are no clear price patterns over the last few weeks; prices and the EMAs are in a tight range; the RSI and MACD are somewhat directionless. The bottom line is this is a market looking for a direction.

Thursday, August 27, 2009

This Recession is Over

Market recap in the AM. I think this needs to stay up for awhile.

- by New Deal Democrat

Back in the gloomy days of last December, I wrote that an Obama economic recovery was possible in the second half of 2009:

Elections have consequences ....[A] new Administration in Washington populated by Economic Adults may ..[appreciate the]... pressing need for massive infrastructure investments that can lead to renewed bank lending and economic expansion on Main Street.

Eight months later, I am ready to say, that day has come. As Paul Krugman said earlier this week, "almost for sure the business cycle leading committee will eventually decide the recession ended this summer." This recession is over.

Most economic observers just project past trends - usually based on data that is coincident or lags the general economy - into the future, and so they miss important turning points. In short, they get it wrong. Even now, many are simply reporting the poor recent trajectories of data between 2008 and 2009 (exactly as could have been done at the end of the 1974 and 1982 recessions), and projecting that there is still an ongoing decline that will continue, or else picking through almost relentlessly positive economic reports looking for a negative number of some subset to grasp onto. There clearly are some nasty negative numbers out there. Jobs are still being lost and wage increases have become almost non-existent. International trade as reflected by the Baltic Dry Index and the LA and Long Beach ports data is negative. States and municipalities are still facing declines in tax revenues -- although the year-over-year comparisons are getting less negative.

What pundits miss is, there is a economic cycles run in a typical order including both expansions and recessions, as demonstrated by Prof. Edward Leamer:

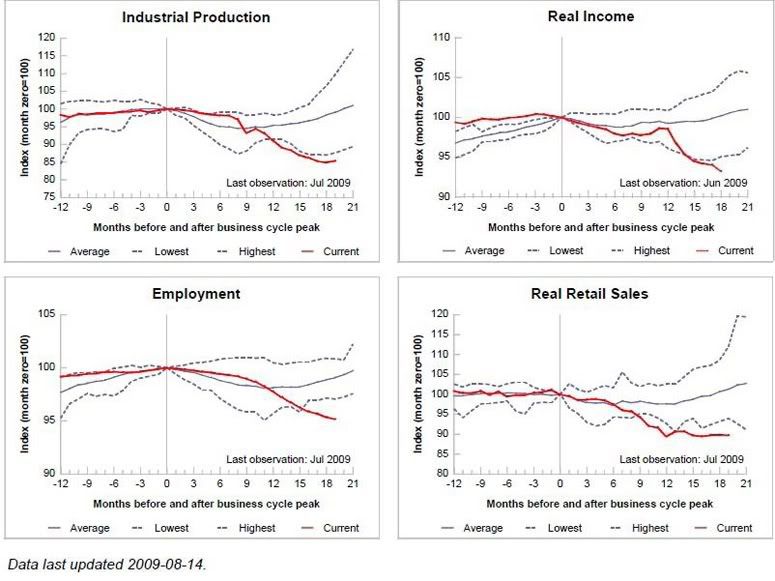
The temporal ordering of the spending weakness is: residential investment, consumer durables, consumer nondurables and consumer services before the recession, and then, once the recession officially commences, business spending on the short-lived assets, equipment and software, and, last, business spending on the long-lived assets, offices and factories. The ordering of the recovery is exactly the same.

In fact, many aspects of the economy have stabilized. Many more have actually turned positive, including the most forward-looking aspects listed by Prof. Leamer above.

I.
As Bonddad and I pointed out three months ago, the best way to look into the economic future is usually just to look at the Conference Board's Index of Leading Economic Indicators, which are: real money supply, average weekly manufacturing hours, interest rate spread, manufacturers' new orders for consumer goods, supplier deliveries, stock prices, consumer expectations, building permits, average weekly initial claims for unemployment insurance, and manufacturers' new orders for durable goods.

Ours was a decidedly minority opinion that the worst of the decline had probably already occurred. We noted that as of April 8 of those 10 LEI's had turned positive or at least neutral. Three months later, that trend has been reinforced. the LEI continued up by 1.2% in May, .9% in June, and .6% in July. Unless there is a meltdown in the stock market in the next few days, August looks like it will print + as well.

The ongoing strength of the LEI's means that a prefect trifecta -- three out of three LEI measures linked with +GDP are positive *NOW*. Per Paul Krugman, we may have entered purgatory, but the fact is we are out of hell. While it is certainly possible that speculators could foolishly drive the price of Oil over $100 again, and trigger another recession next year, the simple fact is, this Recession is over.

First, in the past, +LEI readings for 3 months in a row has typically meant the start of +GDP. Here is a graph, showing that since WW2, every time there has been a significant (~2%) turn up in the 3 month average of the LEI, a recovery (in the sense of +GDP growth) has started immediately. We got the third positive monthly reading in June. Since March, the index has increased from 97.9 to 101.6, well in excess of 2%.


Second, when the year over year reading of LEI is positive, that typically means the +GDP has begun. In July 2008 the LEI stood at 101.2 (2004=100). As of June 2009, the LEI stood at 101.0 (after a +0.1% revision). July's 0.6% increase puts the index at 101.6, which triggers the second signal. Here it is graphically:


Third, when 9 of the 10 indicators have been positive for 6 months, it has always signaled +GDP:


As of yesterday's +4.9% increase in durable goods orders, 9 of the 10 indicators now meet the criteria. Only new orders for nondurable consumer goods has not turned positve yet. All 9 of the others -- money supply, manufacturing hours, the bond yield curve, stock market, consumer sentiment, ISM manufacturing purchasing managers index, new orders for durable goods, and first time unemployment claims -- all of them are now positive over the last 6 months.

I'll spare you the bullish charts of stocks, bonds, and money supply, but here are the rest:

Note that housing permits, the purchasing managers index, and consumer sentiment are all up over 10% from their bottom reading (left scale). Average manufacturing hours (red) is shown on the right scale. Meanwhile, initial claims for jobless benefits have decreased close to 15% while manufacturers new orders for durable goods, after trending sideways, turned strongly positive in July (the most positive monthly reading since the beginning of the recession):


This is an enormously positive development, which as suggested by the coincident index (in yellow in the graph second from the top above), is beginning to show up in the coincident statistics, on which more below.

II.
Some people have said that we shouldn't rely on the LEI's, because this recession is different than post WW2 recessions. Unlike postwar recessions, all of the recessions during the Roaring Twenties and the Great Depression featured deflation. With the exception of the 1937-38 recession, no safety nets were in place. But we do have data from that era, and that data supports our conclusion as well.

First,wholesale and consumer price data has been collected for almost 100 years. The graph below shows consumer prices in blue, and wholesale prices in red, during the 1920s and 1930s. Notice that the cycle was a collapse in wholesale prices accompanied by deflation in consumer prices. At the moment that the economy was on the cusp of expansion, there was already increased demand for commodities, so wholesale prices started to firm; and the increased consumer demand meant that CPI started to firm on a year over year basis:


A similar dynamic is taking place right now:


Notice how last year both wholesale and retail prices pitched headlong into deflation. Currently, YoY CPI is running -2.1%. Because late last year featured readings of -1.0% a month or similar due to the collapse in oil prices, the YoY PPI and CPI are almost certainly at their bottom right now, and will increase starting next month. That will indicate increased demand, and tin turn GDP growth.

Second, there was a similar housing bubble in the 1920s. In fact, accounting for the difference in population, it was actually worse than the one earlier this decade. Housing starts declined for several years before 1929, and collapsed thereafter, bottoming in 1933 before recovering. Here's the graph (from a 1954 text) showing that process (the raw data can be found here).


Per Calculated Risk, "housing led the way out of the Great Depression." Unfortunately, housing data was only connected yearly then. Now we have monthly data, but two former noted housing bears, the aforesaid Calculated Risk and Tim Iacono of "The Mess that Greenspan Made" now believe that more likely than not, the bottom for housing starts took place in January of 2009. If any further proof was needed, yesterday's blowout good number for new home sales -- which also showed that inventory decreased to a more normal 7 months from its high of about 1 year --

put an exclamation point to the data.

III.
Three months after our initial call, not only are the LEI's continuing to support our position, but now 2 of the 5 coincident indicators that members of the NBER use to date recessions are also up from their bottom, and a third stopped declining last month. Specifically,

real retail sales may have hit bottom in December 2008, and after plummeting for months, industrial production surprisingly turned up 0.4% last month. Personal income is still declining badly, and employment is also still declining, although less so than earlier this year. But here is the graph of total hours of private employment (that has also been flagged by a member of the NBER as important to him in dating recessions), which stopped declining last month, just as it did at the end of the 1990 and 2001 recessions (In previous recessions, this indicator declined into the end of the recession, and then reversed course on a dime):


Other coincident data is stabilizing or trending positive as well. The July trucking index just came out, reversing the June loss. On a smoothed basis, that index is now flat.

The railroad car index has trended firmly upward for over a month now as well, after having moved generally sideways previously in the year.

And of course, let's not forget auto sales:


For those wondering what the source of growth in a recovery will be, the answer taking shape is: durable goods like housing and autos, manufacturing in general, and exports to increasingly prosperous Asian consumers.

Conclusion

Reporting economic data like "leading economic indicators" is a cold business, that doesn't capture the day to day struggles of those living through hard times. This truth was recently described passionately by a housing activist who deals with a lot of really poor and struggling folk. She described how even if the economy turns around, a lot of people -- maybe even a majority of people -- are still in a world of hurt. She sees a division between ever fewer haves and ever more have-nots as the outcome even of an economic recovery.

Her point is both vital and correct. It is essential that the current democratic Congress and White House show by words and deeds that they are taking the plight of the people at the bottom of the economic ladder. with the real sense of urgency it deserves. It is also essential, now as the economy turns positive, that real reforms be enacted to ensure that the benefits of American productivity are shared by all its people, not just those few at the very top. A commentator called what Washington has done in the last year "an extreme series of New Deal for Wall Street programs" which captures insiders' priorities perfectly. The need for a jobs policy in this country to fix the chasm whereby we get "jobless recoveries" that require 2% GDP growth on an ongoing basis before a single net new American job is created (a point has now been embraced by Paul Krugman as well) is now directly in the spotlight. Real, long term structural reform of the economy beyond health care is critical and ought to be a highest priority.

In the meantime, the simple truth is, in the three months since Bonddad and I posted our joint diary, our case that a return to +GDP is close was strengthened by nearly all of the data, and at long last it is time to state the simple truth: Bonddad and I were right. This Recession is over.

From Bonddad: I'm in complete agreement with NDD on this one. I would add that initial unemployment claims are trending down, the New York and Philly Fed numbers are still increasing, existing home sales have stabilized, durable goods orders have bottomed on a year over year basis and showed s solid jump last month, the credit markets have clearly settled down and are back to pre-crisis levels, and commodities' are increasing indicating an expected increase in demand.

I would also add this: NDD makes a solid point about how these numbers are cold and rather inhuman sounding. I wish there was a way to personalize this information more. But, that is infortunatly the nature of the business.

A Note On Government Statistics

For the last few years there has been a continuing debate about government statistics. Some people argue they are seriously flawed, some think they are fine. The site most cited in this argument is Shadow Stats. Shadow stats made some claims regarding inflation which I (regrettably) bought into. The BLS later debunked these claims. For a summation of this situation, go to this link.

I have not found a single article or paper from a person in the field of statistics or economics that makes a credible claim that the government statistics are so seriously flawed as to be devoid of any substance. In fact, after doing a search of the social science research network's paper database (www.ssrn.com) I could find no paper near that point. In addition, I'm a big consumer of the financial press and I have not seen any raging debate about government numbers.

In short, if you are going to argue that the government numbers are flawed, please present credibly evidence -- not a website, not an "I just know it" argument. And Shadow Stats has already been debunked.

Thursday Oil Market Round-Up

The oil charts are very interesting largely because they are pretty conflicted. As always, click on all for a larger image.

First, the bullish side. Prices are rising and the EMA picture points to higher levels. The 10 and 20 week EMA are moving higher, the 10 week EMA has crossed over the 50 week EMA and the 20 appears ready to do so. Now the bearish side. The RSI printed a lower number on the second price top and the MACD's upward trajectory is less. The first point is very concerning as it indicates recent prices are less technically strong than earlier prices. The MACD issue is one of subjective interpretation. I would like that angle to be higher as prices move higher.


The daily chart is also split. The bullish side is that prices and the EMAs are increasing; the shorter EMAs are above the longer EMAs -- the most bullish configuration possible. However, despite the increase in prices, the RSI is not increasing. In fact, it has been posting moderate numbers throughout the recent rally. And as with the weekly chart, the MACD is is still in a weak uptrend.

The central question with this chart is are we forming a double top? We're nearing the end of the summer driving season which is a traditionally bearish time. However, we've also seen some strong economic prints from other parts of the world. China and India never really hit a recession; Germany and France grew last quarter. All things are pointing to an increase in oil demand.

Wednesday, August 26, 2009

Today's Market


Click for a larger image

The markets have been in a trading range since August 24. We have upside resistance at 104.26 and support at 102.5. There are no indications about where the market will move -- we get to wait and see.

More Good Economic News

Over the last few days we're seen come good economic reports come out. Let's go to the data (click on all pictures for a larger image).


On the year over year price chart of the Case Shiller index we're still in negative territory. But, the rate of decline appears to be decreasing. This is a very important development as it indicates the price free-fall may be over. In addition,


This is the second month in a row when we're seen the month to month price movements print around 0 or slightly positive. This is not a trend yet. But we're clearly moving in the right direction.

From the Census Bureau:

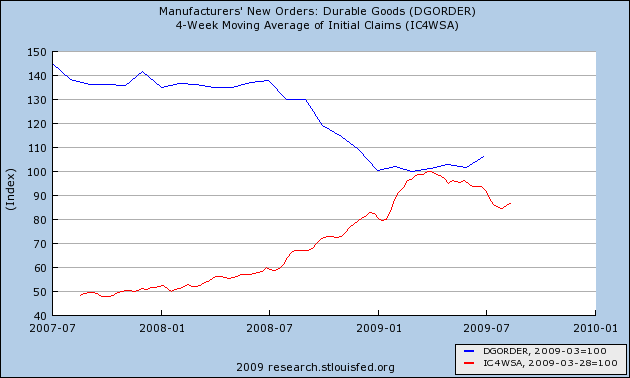
New orders for manufactured durable goods in July increased $7.8 billion or 4.9 percent to $168.4 billion, the U.S. Census Bureau announced today. This was the third increase in the last four months and the largest percent increase since July 2007. This followed a 1.3 percent June decrease. Excluding transportation, new orders increased 0.8 percent. Excluding defense, new orders increased 4.3 percent.


Here is the chart:


Notice that last month was a big jump. But even without transportation orders we still saw a big increase. And notice that year over year number has bottomed out as well.

And finally we have this:

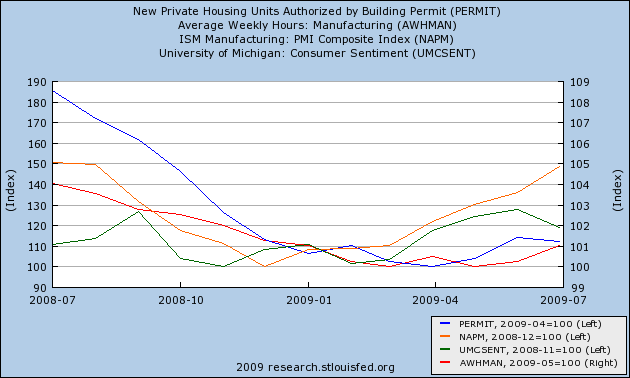
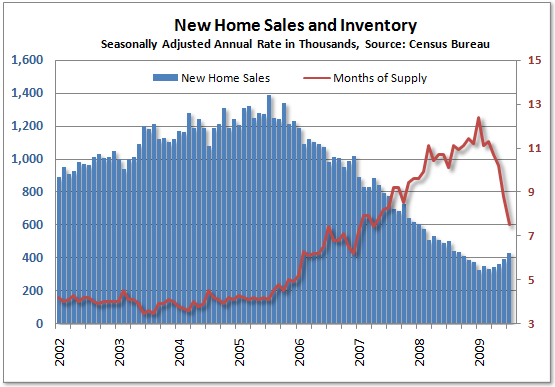
Purchases of new homes in the U.S. jumped more than forecast in July, adding to signs that the economy is rebounding from the worst recession since the 1930s.

Sales increased 9.6 percent, the most since February 2005, to a 433,000 annual pace, figures from the Commerce Department showed today in Washington. The number of houses on the market dropped to the lowest level in 16 years.

The gain in sales, together with rising purchases of existing homes and steadying prices, indicate the housing slump may be ending as Federal Reserve efforts to thaw credit and the Obama administration’s first-time homebuyer incentives lift demand. Job losses and mounting foreclosures mean any rebound in construction may be limited.

“We’re seeing a clear pickup in housing activity,” said Michael Moran, chief economist at Daiwa Securities America Inc. in New York. “The correction phase is essentially over and we expect continued improvement, though not a vigorous pickup.”


Here is the chart:


Notice that the pace of home sales appears to have bottomed in the early part of this year and have been rising since.

These are all good developments and add further credence to the bottoming argument.

A Look At the CBOs Latest Projections

Yesterday the CBO released its long-term budget outlook. It is a lengthy document that involves an area of economics that I find highly questionable: long-term projections. I understand why we must include them and why they are done, but I still find them questionable because they are 50+ year projections. Let's look at a key point:


Basically, it's about spending on medical care. That is the primary driver for the increase government expenditures. That is also why it is imperative that we figure out a way to hold down costs.

Let's look at some charts that highlight the problem. Click on all for a larger image


Social security isn't the problem. It increases to roughly 6% of GDP and then remains stable. This is an entirely manageable situation. However,


Medical costs -- the net total spending of medicare and medicaid -- continue to increase until they reach 18% near the end of the decade. That is obviously unsustainable and again highlights why reform is mandatory.

I'm still working through the data.

The CBOs information is here.

Durable Goods Orders blow out to the upside

- by New Deal democrat

Manufacturers' new orders for durable goods were reported up +4.9% by the Census Bureau, significantly higher than expectations. Last month's initially reported decline of -2.5% was halved to -1.3%.

Beyond simply being one month of particularly good data, manufacturers' new orders are a component of the Leading Economic Indicators, and are now decisively higher than at any point since the end of last year. This also completes the third part of an important trifecta of LEI indicators -- more on that tomorrow.

For those asking, "What will the economic recovery build upon?" we have at least part of our answer. It will be done the old-fashioned way, via manufacturing.

Wednesday Commodities Round-Up


The weekly agricultural prices chart is weakening. First, notice all the EMAs are now moving lower. The shift has been subtle but it's clearly there. EMAs smooth the price action so we can see in real time what the current short, medium and long-term trend line looks like. Here, all the trends are now moving lower. In addition, prices are now below the trend line that started in late 2008. That's negative as well.


On the daily chart we see a very neutral situation. First, prices and EMAs are in a ntight range indicating a clear lack of direction While prices are still above a trend line, most of the price action has been to hug the line; an attempt to move above it could not be sustained. Clearly, traders are wondering where to move prices next.

Tuesday, August 25, 2009

Today's Markets


Click for a larger image

Above is a chart of the transportation average. I included it because it hasn't risen above previous levels. In fact it may be forming a double top. Notice that even though we are seeing second top, the underlying technicals of that top are weak -- the RSI is lower and the MACD is printing a lower number. That means the prices in the second top are weaker than the first which is not a good development.

Bernanke To Get Second Term

From the WSJ:

Wall Street and academic economists in recent weeks showed enthusiasm for giving Mr. Bernanke a second term, and some administration insiders felt similarly even though Mr. Bernanke was appointed by -- and served in the White House of -- President George W. Bush. Appointing a Democrat such as Janet Yellen, president of the Federal Reserve Bank of San Francisco, or Alan Blinder, former Fed vice chairman -- both former advisers to President Bill Clinton -- would have been popular with many Democrats. But a move by Mr. Obama to install his own person at the Fed might have have rattled markets and unsettled the foreign investors.

"I think this is a good thing for the markets," said Byron Wien, chief investment strategist at Blackstone Group. "Rather than going through a catechism of what Bernanke's done wrong, let's look at the net result. The economy is improving and the financial system is on the mend. It's a long way from perfect but it's also a long way from where it was a year ago."


Sometime over the last six months I was re-reading the Depression section in Milton Friendman's A Monetary History of the US. There is a chapter called The Great Contraction which details the banking system problems of the 1929-1933 period. Essentially, there were three banking panics over that time period which essentially froze the US economy and led to a huge drop in GDP. This is what Bernanke was trying to avoid with all of his plans. And -- he's been successful as the economy is currently bottoming.

The primary knock against Bernanke is he didn't see the mess coming. This is true. Oddly enough, the only people to see this coming were economic bloggers. There is a general train of thought going around that people who didn't see this mess shouldn't be involved in the clean-up. But frankly, Bernanke's outside the box thinking on how to solve the credit market problem should get solid marks. And the real grade should come in the performance of the credit markets since Bernanke's massive intervention. Interest rates are down. That tells us the risk premium has been priced at a far more normal level which is a damn good thing.

Ben is one of the key players that has helped us to get out of the mess. He deserves a second term.

From Invictus: CFNAI Update II

Those who have followed me over at Blah3.com know of my affinity for the Chicago Fed’s National Activity Index (CFNAI). I like it because it’s an amalgam of 85 distinct data points that has a very good historical correlation to the ebbs and flows of the business cycle.

The Chicago Fed describes it this way: “The CFNAI is a weighted average of 85 existing monthly indicators of national economic activity. It is constructed to have an average value of zero and a standard deviation of one. Since economic activity tends toward trend growth rate over time, a positive index reading corresponds to growth above trend and a negative index reading corresponds to growth below trend.” (See here for a .pdf of the 85 components and their weightings.)

The folks in Chicago also advise us to look at the 3-month moving average for a better take on what’s going on with the economy.

I posted here with an update to this week’s CFNAI release, which printed at -1.69 (3-mo MA).

This recession is the seventh covered by the CFNAI. Of the previous six, only three have seen the 3-month MA dip below -2.00, and our current recession hit -3.63 in January. So I thought it might be interesting to see what the prior deep (CFNAI breaches -2.00) recessions looked like in CFNAI terms. Here’s what I found:


The 1973 recession ended in its seventeenth month (March 1975) with the 3-month MA of the CFNAI at -2.96. However, although nonfarm payrolls printed -186k in April 1975, it printed +160k in May, and was off to the races starting in July. We’re not there yet on employment.

The 1980 recession saw the recession end with the 3-month MA at -2.20; the very next print was -0.89. Unfortunately, that recovery was unsustainable, and the economy slipped back into recession about one year later, with the 3-month CFNAI spending most of that time in negative territory and never moving above 1.17.

For the three “deep” recessions, the average 3-month CFNAI value in the first month of recovery is -1.45:


As I mentioned previously, I continue to be very concerned about sustainability, and strongly suspect the NBER is going to take its sweet time to make an announcement, as they need to be sure the economy is standing on its own two feet and not being propped up primarily by government largesse. Having said that, we appear to be on the cusp of moving toward a number that might signal recession’s end – or at least a brief hiatus until its resumption.

American Stupidity

Ever wonder why America can't seem to shoot straight on some issue? Here's why:

From the NY Times:

Chinese companies have already played a leading role in pushing down the price of solar panels by almost half over the last year. Shi Zhengrong, the chief executive and founder of China’s biggest solar panel manufacturer, Suntech Power Holdings, said in an interview here that Suntech, to build market share, is selling solar panels on the American market for less than the cost of the materials, assembly and shipping.


So, that's the stage we're setting. There is an industry which is obviously going to be a tremendous driver of growth. But is the US a driver? No. Let's look at why:

Backed by lavish government support, the Chinese are preparing to build plants to assemble their products in the United States to bypass protectionist legislation. As Japanese automakers did decades ago, Chinese solar companies are encouraging their United States executives to join industry trade groups to tamp down anti-Chinese sentiment before it takes root.


This doesn't happen in the US. Why? There is a contingent of incredibly stupid people in this place called Washington. They typically have an "R" after their name. According to their political ideology, this is "picking winners" which the market is supposed to do. So, instead od pouring money into a sector that is growing we're left with nothing.

But wait -- there's more:

Since March, Chinese governments at the national, provincial and even local level have been competing with one another to offer solar companies ever more generous subsidies, including free land, and cash for research and development. State-owned banks are flooding the industry with loans at considerably lower interest rates than available in Europe or the United States.


There is another party in the US called the Democratic party. And their vocal minority that seems to get all the press is very anti-business. Working with corporations is bad and evil; money was invented by Satan to corrupt our souls. Profits are terrible and horrible and should be avoided.

This is why other countries get ahead of us. They don't listen to the screamers on either side of the political aisle.

Treasury Tuesdays


This is a very interesting chart. There are currently two key features. First, notice that the 91.5 level has offered a tremendous amount of resistance -- prices have approached that level three times in the last month of so only to be rebuffed. Secondly, notice that the EMAs are bunched together in a tight range and are tied together with prices. This tells us the market is pretty directionless right now.

From a fundamental view, this directionless makes sense. There is a tremendous amount of supply coming to market which is adding downward pricing pressure. However, there is continued talk of the market's need to sell-off a bit, which would increase Treasuries appeal because of their safe haven status. In short, the cross currents are strong right now.

Today's Markets

OK -- it's yesterday's market. Anyway ....


Click for a larger image

First, notice the market sold-off a bit from roughly the first week of June to the first week of July. What's interesting about this is no one is mentioning it, even though there is now current talk of the need for the market to sell-off a bit. Was this sell-off enough to scare out the less convinced traders? Who knows. But the point is maybe this blow-off was enough for the market to move higher.

The upward move is still in place. It started in early July and shows no signs of abating. In addition, the MACD is about to give a but signal. All the EMAs are moving higher, the shorter EMAs are about the longer EMAs and prices are above the EMAs. The only bearish element to this chart is the RSI is dropping. However, no chart is perfect -- that is, not chart will ever give you a situation where it shows only buy signals.

Bottom line, the percentages say we're moving higher.

Monday, August 24, 2009

Today's Market

Long day -- just getting back. I'll post this in the morning.

BD

From Invictus: CFNAI Update

CFNAI Update

The Chicago Fed published its National Activity Index (CFNAI) this morning, and let’s go straight to the video tape:


Click for a larger image

The 3-month moving average printed at -1.69, up from last month’s -2.18.

We’re getting there, but:

1) I would note that only once – in April 1975 – was the 3-month moving average -1.69 or worse (it was -2.24 that month) after a trough (e.g. on the upswing) with the economy out of recession. With the next print, if the trend continues, we might talk about the recession having ended this month. In the six previous recessions covered by the CFNAI, the average print in the last month of recession is -1.81, and the average in the first month of recovery (the following month) is -1.16.

2) I’m probably not alone in being worried about the sustainability of any recovery, and I’m sure the NBER is going to wait to see whether or not any recovery is, in fact, sustainable, or if we simply stagger along as various stimulants (“cash for clunkers,” the $8,000 first-time homebuyer credit) wear off.

3) Closely related to #2, I’m concerned about the consumer’s ability to re-engage and start spending on much more than necessities.

So, through my lens, another improvement, another “less bad” print, but still premature to sound the all-clear.

Party Like It's .... 1937

There's a great piece today in the WSJ about how the Federal government is studying the policy train wreck that was 1937 in order to prevent it from happening again. Basically, the government is studying how to take the current punch bowl away without killing the economy. Here are some key points:

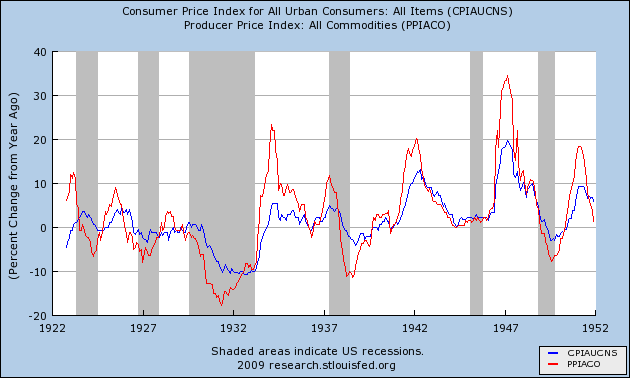
The economy was recovering briskly during Franklin D. Roosevelt's first term in the White House. The jobless rate, which had peaked at 25% in 1933, fell to 14% in 1937 -- not exactly cause for celebration but a relief nonetheless.

The comeback stalled in 1937. Banks, nervous about the fragile recovery, were holding huge amounts of cash in reserve at the Fed. Fearing an inflationary surge should the banks decide to lend that money out to businesses and individuals, the Fed -- which had made the mistake of tightening monetary policy soon after the 1929 stock-market crash -- miscalculated again. The Fed ratcheted up banks' reserve requirements three times, starting in 1936. The banks reacted by cutting lending even further.

"There's no doubt that [Fed Chairman Ben] Bernanke is heavily influenced by these two mistakes of the Fed during the Depression and is absolutely intent on not repeating them," says Alex J. Pollock of the American Enterprise Institute, a free-market think tank in Washington.

Compounding the Fed's errors, the federal government tightened fiscal policy. Congress approved a big bonus for World War I veterans in 1936, providing a spark of consumer spending. But lawmakers allowed the subsidy to lapse in 1937. At the same time, the government began collecting the first Social Security taxes, on top of income and capital-gains tax increases that Mr. Roosevelt approved in 1934-35.

Tightening the monetary and fiscal screws sent the economy into free fall again -- the second trough of the W. Unemployment shot up to 19%, prolonging the nation's suffering.


There's a ton of very useful and historically important information here.

1.) GDP dropped from 1929-1933 but returned to 1929 levels in 1937. While unemployment was still high, notice that it did drop a solid rates. Bottom line, by 1937 we were on the right track.

2.) The Fed increased reserve requirements at exactly the wrong time. This point is often lost in history and is an incredibly important point. Politically charged analysis points to 1937 as a reason the government intervention failed. In fact, as classic monetary policy informs us, decreasing the money supply at the wrong time contracts the economy.

3.) In addition, note that tax policy is vitally important. Raising taxes during the middle of an economically fragile time is also incredibly stupid. The best time to raise taxes is when the economy is humming along and has been for at least a year. In addition, you can't just ratchet up tax rates; you have to do it gradually.

Market Mondays


The SPYs weekly chart is still very bullish. The MACD and RSI are still rising. The 10 and 20 week EMAs are increasing. The 10 week EMA has crossed over the 50 week EMA and the 20 is approaching that level. Finally, prices are above all the EMAs which will help to pull the EMAs higher.


The daily chart is also showing bullish tendencies. First the price/EMA relationship is bullish. Prices are above the EMAs, all the EMAs are moving higher and the shorter EMAs are above the longer EMAs. In addition, the MACD is about to give a buy signal and prices have recently moved through key upside risistance levels.

Also consider the following personal observation. Over the last few months there have been two times when the technicals lined up for a bearish move. Both moves failed. That does not mean my analysis was perfect by any stretch of the imagination. But I also wasn't the only one making the call or seeing things that was. The point is this is a market that wants to move higher. And it is on a regular basis. That is extraordinary.