Almost 10 months ago Bonddad and I caused a sh*tstorm at the Big Orange Political Blog when we pointed out that most of the items that are reflected in the Leading Economic Indictors showed signs of turning around. We said then, improving Leading Economic Indicators lead to GDP growth, which in turn leads to Job Growth.
Via Jake at Econompix, (and h/t Dr. Donald J. Oswald) we have the following graph of the LEI and GDP for the last 50 years. As Jake acknowledges, the graph clearly shows that LEI does lead to GDP growth, and has so now:

Jake questions whether the relationship is as strong now as in previous recoveries. Certainly if you eyeball the December LEI which is the latest datapoint on Jake's graph, and compare it with YoY GDP for 4Q 2009, it looks weaker. But that may be misleading because typically the quarterly GDP is shown equivalent to the first month of the quarter on graphs, and the LEI continued to surge in the October-December period, from ~+5.0% to ~8.0%.
In this regard, the improvement in LEI in the last year is very different from the "jobless recovery" of 2002-03, in which the LEI only exceeded +5% YoY during one month -- July of 2002, that coincided with one single quarter of GDP growth over 2% (2.3% to be precise), and did not again exceed 5% until July 2003, coinciding with 2.9% GDP growth and the first actual job growth.
In contrast, during the V-shaped recovery from the deep 1982 recession, the LEI went from a -1.4% YoY decline in October 2002 to 7.5% YoY growth in February 2003 and by April were up 10.4% YoY. Job growth started in January 2003 and was strong thereafter. Much like the current strongly positive trend in the LEI as noted above.
If the LEI continue to lead GDP, GDP is also continuing to lead jobs, as this graph of YoY % changes updated through January shows:
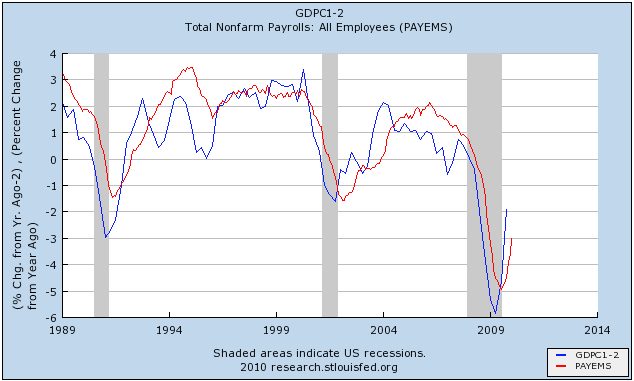
In the last 15 years, YoY GDP growth of more than 2.3% has always meant YoY job growth within 6 months thereafter, and 2% YoY GDP growth has coincided with monthly job growth.
The KISS indicator of a positive yield curve + underlying inflation indicates that we continue to be on course for good economic growth in the first half of this year. We are probably going to show positive GDP growth in excess of 2% YoY this quarter, and depending on revisions, could be close to 3% YoY.
Further, the "holy grail" of real retail sales continues to improve:

About the only negative indicators for jobs that remain are the ISM non-manufacturing index and the continuing slide in commercial real estate and state and local government budget stress. Meanwhile, the Case-Schiller housing index gets reported tomorrow, and a little-noticed but important metric has reversed course. More on those later.