Last September I wrote a series entitled When will the economy add jobs? that looked at a bunch of "Leading Employment Indicators." Although it came up a little short, in retrospect it was a pretty good effort. The economy had been losing 200,000 or more jobs a month when it was written, and although we only got one positive month since then, the average in the last four months has only been -25,000 (-30,000 if you back out census jobs, which is reasonable).
As I commented the other day, the laggards have primarily been construction jobs, and also government jobs. Government jobs always lag, so the difference is mainly the continued losses in construction jobs. Back out construction losses, and nonpfarm payrolls bottomed in December and almost 100,000 jobs have been added since then. In other words, my index did a good job predicting the turnaround in service and manufacturing jobs, which doesn't seem too shabby. Since housing has had a miniscule recovery (and commercial construction is receiving last rites), I'll have to look for a good reliable leading indicator in construction to add into the formula.
But it may be moot now, because just about every other indicator imaginable suggests we are at the turning point for jobs.
Our co-blogger Invictus made a point late last year of how historically the household survey tends to lead (by 1 or 2 months) or at least turn coincidently with the establishment survey. He was concerned at that point because it hadn't. Here's how the establishment survey led nonfarm payrolls out of the last two recessions:
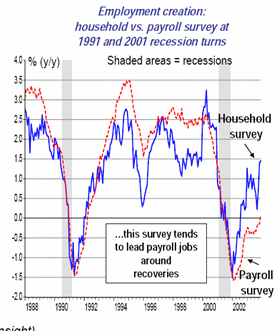
As Bonddad and I both pointed out yesterday, it looks like the household survey may have bottomed in December 2009:

Beyond that, in Part 3 of my jobs series last September, I considered and rejected an indicator based on duration of unemployment, because it was too coincident. I said then that "an examination of jobs data shows that it always troughs at or after the peak in the 5-14 duration weeks' employment data, but coincident with or slightly before the 15-26 week data." I also pointed out that "
durations of unemployment data tend to become very "saw-toothed" as they approach and then recede from their peaks. The biggest pre-peak sawtooth in the 5-14 week data is 10%. Since we have already declined about 18% in that series before the recent upward move, that series has probably already peaked. But we have only declined about 7.5% from the peak in the 15-26 month data, which in the past has had a pre-peak sawtooth of 15%. At best, if we get a drop of more than 15% in that data, it might give us one month's lead on the trough in the jobs data."
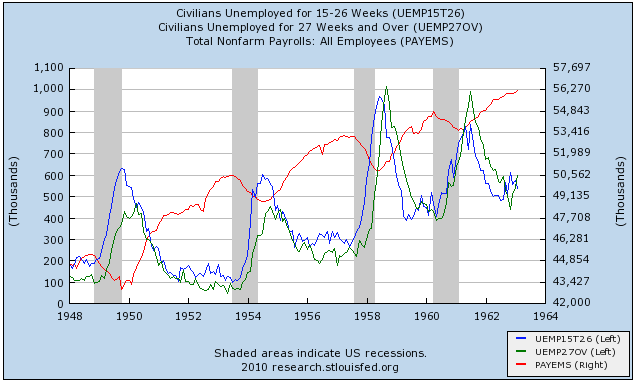
Here are the graphs I used to show that point, first for the period of 1948-63:
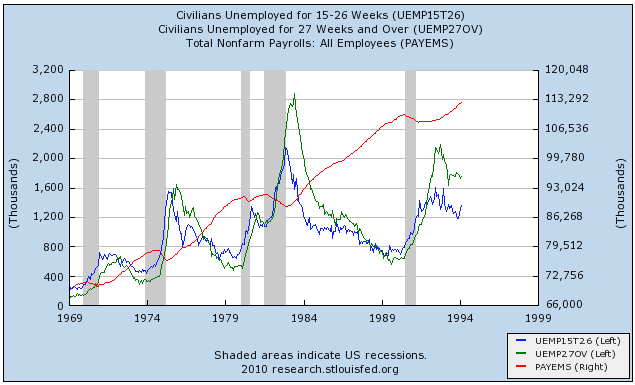
and then for 1969-1994
and finally, here it is for the last 10 years:
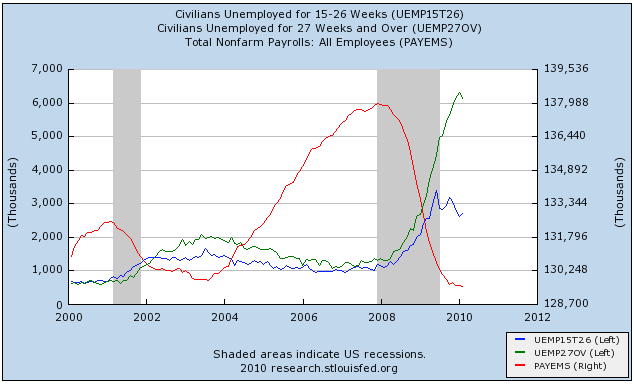
In all series before this one, the red line above peaks at or before the blue line (unemployment from 16 to 27 weeks' duration) does, and in the last "jobless recovery," coincident with longer term unemployment.
In the last few months, not only has unemployment of 5 to 14 weeks turned down nearly 20%, but unemployment of more than 26 weeks also posted a decline in February. That does not mean the longest duration employment has definitely peaked, but it certainly looks like the topping process has begun, and the decline in 15.26 weeks is the real deal.
If the past relationship holds, the turning point for jobs is now.
Tomorrow, I'll discuss unemployment.
N.B.: I am on a brief getaway and may not be able to respond to comments until Wednesday.