Besides posting here, Bonddad and I not infrequently have phone conversations about the markets and economy (I know, you're shocked). Over the weekend, I noted that almost all of the data started to head south at precisely the same time -- late April. Commodities, stocks, bond yields (more on that below), mortgage applications, the index of leading economic indicators, YoY CPI -- all appeared to stall or began to decline at almost the exact same time.
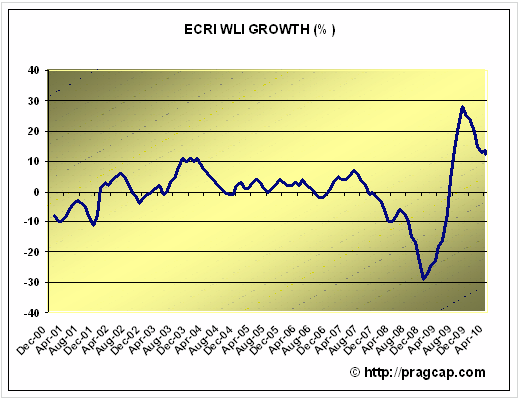
In fact, here is a graph I posted at the time of ECRI's leading index, which had been on a tear for a year (following their gutsy and correct call that the Great Recession would bottom last summer). As of mid-April, it had slowed from white hot to red hot -- still showing better growth ahead than at any time since 1983:
And yet, 45 days later it had crashed into negative territory:
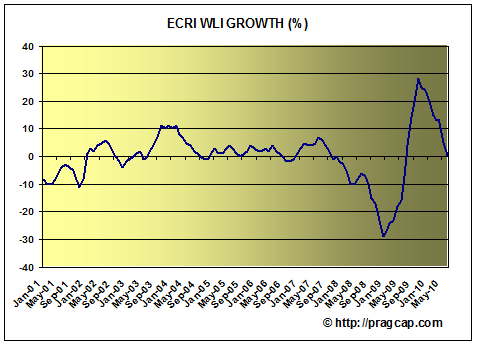
Unless we are to believe that we will have blazing growth for the next few months and then hit a wall, an index that plummets that fast in 45 days has a problem. Of course, I should qualify that by noting that the we did actually have non-census job growth in both May and June, and real income has been increasing, as has industrial production. So the coincident incidators are still going up. It is really all of the short leading indicators (I include real retail sales in that group) that seemed to simultaneiously roll over.
Because we are living in the first deflationary environment in 70 years, we have no idea how most data series perform. There is monthly data from the Roaring Twenties and the Depression Era in a few areas: commodity prices, bond yields, and money supply for example; but the rest was kept on an annual basis if it was collected at all, which is not much help for forecasting or policy analysis. Back when I looked at that data almost two years ago, I did find some trustworthy indicators, but they were frequently coincident or just slightly leading (mainly money supply). I also found comparing YoY commodity vs. consumer changes in prices of some help.
In any event, here are the series I found that rolled over before April, and so are worthy of watching more.
1. The Shanghai stock index.
As Bonddad reiterated yesterday, China now unequivocally leads. It is the global locomotive -- and American consumers are the caboose. As with the US in the late 19th and early 20th Centuries, China is a vast bellows, ultimately blowing hot and cold upon the world's resources. It's stock market now appears to lead the rest. Here is the Shanghai stock index for the last 3 years compared with the S&P 500:
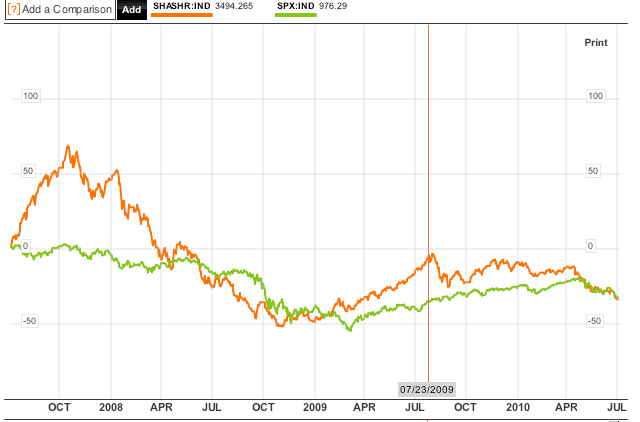
There is simply no question that during that time, Shanghai has been the leader. And it is not comforting that it has not turned back up.
2. Bond yield correlation with stock prices
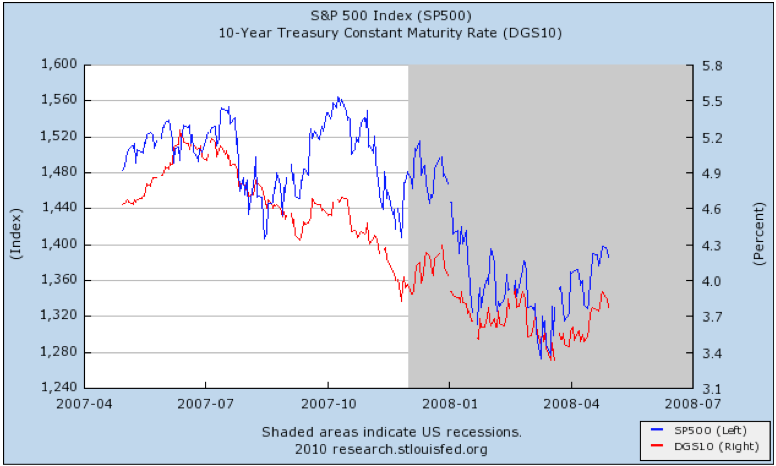
During the disinflationary 1980s and 1990s, bond yields and stock prices moved in opposite directions. That changed beginning in 1998, and generally speaking, continues now. Bond yields and stock prices have generally moved in the same direction, signalling the pre-eminence of DEflation as a concern. During the 2003-2007 expansion, within that range they did move as mirror images, however. They resumed moving in lockstep shortly before the December 2007 downturn, before resuming mirror image movements in the latter part of 2009.
Beginning last December, the stock market and bond yields again resumed moving in the same direction:
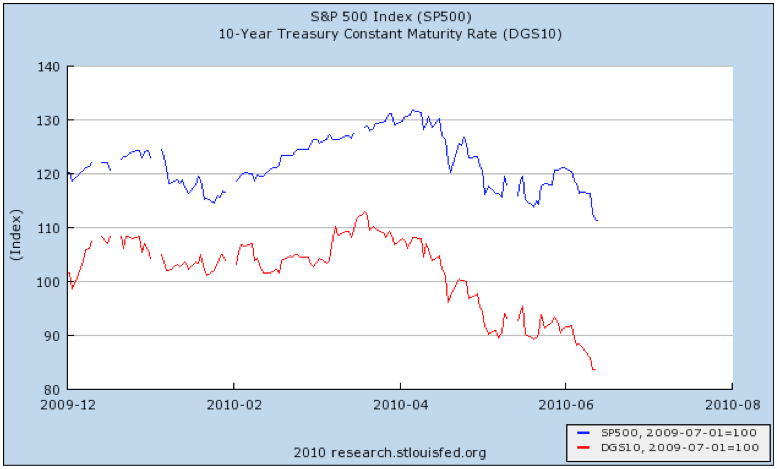
This began at the time of the Dubai sovereign default scare, as bond traders worried (or salivated) over who would be next, and began to focus on Greece. Once again, deflation had moved to the fore. By the way, here is how the same graph looked in late 2007 and 2008:
3. Price growth exceeded wage growth
During the disinflationary/asset bubble period, consumers could either cash out appreciating assets (stocks, housing), or refinance at lower interest rates. No more. Consumers can only spend by building up savings, or if wage growth exceeds inflation. In 2009, wage growth was far in excess of deflation. That changed at the beginning of this year, as mainly due to the price of Oil, YoY inflation again exceeded YoY median wage growth:
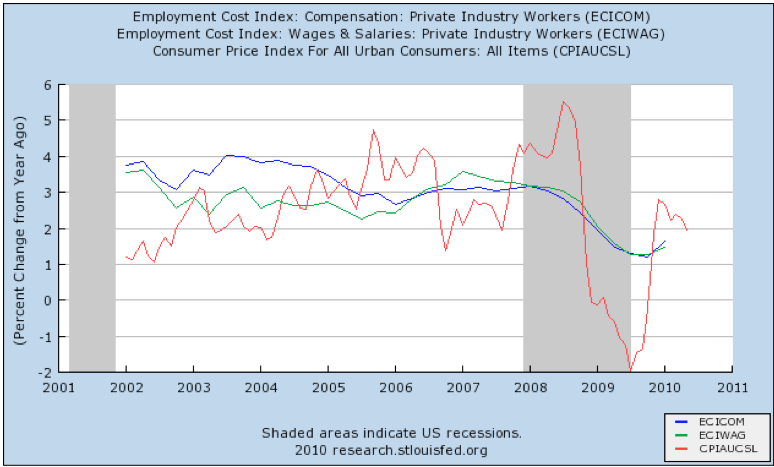
Real spending growth in that environment can only happen by tapping savings, and after 2008, that was going to be very limited. This is a modern confirmation of the trend I noted above about commodity prices and consumer inflation from the Roaring Twenties and Great Depression era.
4. Oil prices approached 4% of GDP and 6% of consumer spending.
Back in January, I predicted a second half slowdown due to increased energy prices. It was disconcerting that they had immediately risen past $75/barrel so soon after the turnaround from the deepest global decline since the Great Depression. So long as the economy improved, it seemed sure that Oil prices would continue to increase as well, until they acted as a choke collar on growth. They indeed did so:
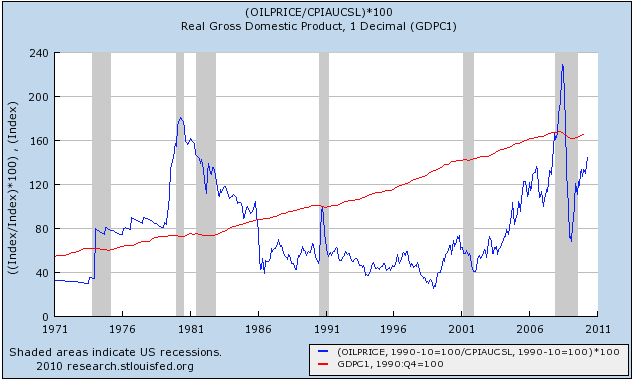
They just grazed the 4% threshold of GDP/6% threshold of consumer spending in April. While Oil prices themselves peaked in April along with nearly everything else, it appeared obvious in January that they would trigger a slowdown or reversal sometime this year.
5. Money supply stalled or shrank
This is another area of confirmation of indicators from the Roaring Twenties and Great Depression. After rising briskly for over a year, at the beginning of this year, real M2 began to decline and real M1 stagnated:
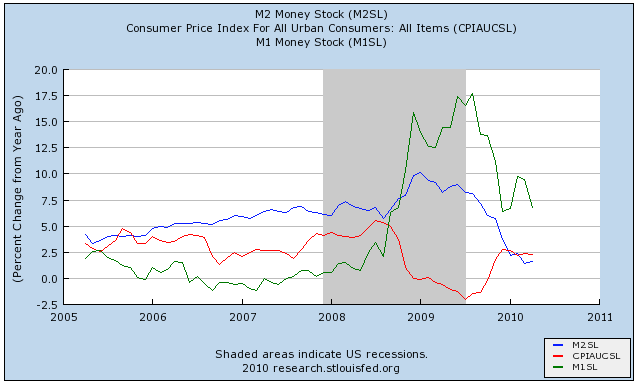
The M2 decline was the chief reason for the tailing off of increases in the index of Leading Economic Indicators. Recessions have typically been accompanied by real M2 growth of less than 2.5%, and real M1 declining. We have the first, which may be turning around now. The second has not occurred.
6. Housing permits and purchase mortgage applications
The MBA's index of purchase mortgage applications peaked last November just before the original expiration date of the $8000 home buying credit. Despite the secondary peak in April, it has been generally in decline since:
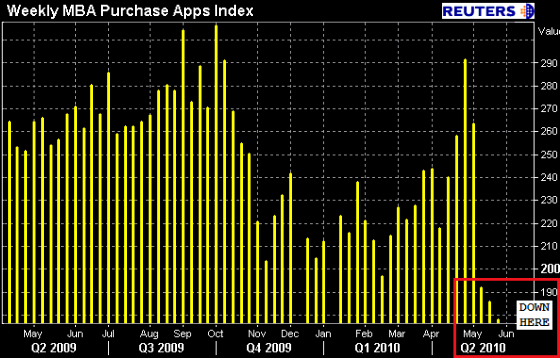
Similarly, housing permits peaked in December and again in March. Housing permits have been the second biggest source of the tailing off of the advance in the LEI, and most likely the MBA purchase mortgage index has been the primary source of the steep and sudden decline in ECRI's index. Housing is a classic "long" leading indicator, and on an annual basis, did lead the 1929 decline by several years, and bottom in 1933.
That's my list. These 6 items have shown that they bear further watching (and generally I do in my "Weekly Indicators" wrap-up). If anybody knows of anything else, feel free to add it to the list in Comments.
1. The Shanghai stock index.
As Bonddad reiterated yesterday, China now unequivocally leads. It is the global locomotive -- and American consumers are the caboose. As with the US in the late 19th and early 20th Centuries, China is a vast bellows, ultimately blowing hot and cold upon the world's resources. It's stock market now appears to lead the rest. Here is the Shanghai stock index for the last 3 years compared with the S&P 500:
There is simply no question that during that time, Shanghai has been the leader. And it is not comforting that it has not turned back up.
2. Bond yield correlation with stock prices
During the disinflationary 1980s and 1990s, bond yields and stock prices moved in opposite directions. That changed beginning in 1998, and generally speaking, continues now. Bond yields and stock prices have generally moved in the same direction, signalling the pre-eminence of DEflation as a concern. During the 2003-2007 expansion, within that range they did move as mirror images, however. They resumed moving in lockstep shortly before the December 2007 downturn, before resuming mirror image movements in the latter part of 2009.
Beginning last December, the stock market and bond yields again resumed moving in the same direction:
This began at the time of the Dubai sovereign default scare, as bond traders worried (or salivated) over who would be next, and began to focus on Greece. Once again, deflation had moved to the fore. By the way, here is how the same graph looked in late 2007 and 2008:
3. Price growth exceeded wage growth
During the disinflationary/asset bubble period, consumers could either cash out appreciating assets (stocks, housing), or refinance at lower interest rates. No more. Consumers can only spend by building up savings, or if wage growth exceeds inflation. In 2009, wage growth was far in excess of deflation. That changed at the beginning of this year, as mainly due to the price of Oil, YoY inflation again exceeded YoY median wage growth:
Real spending growth in that environment can only happen by tapping savings, and after 2008, that was going to be very limited. This is a modern confirmation of the trend I noted above about commodity prices and consumer inflation from the Roaring Twenties and Great Depression era.
4. Oil prices approached 4% of GDP and 6% of consumer spending.
Back in January, I predicted a second half slowdown due to increased energy prices. It was disconcerting that they had immediately risen past $75/barrel so soon after the turnaround from the deepest global decline since the Great Depression. So long as the economy improved, it seemed sure that Oil prices would continue to increase as well, until they acted as a choke collar on growth. They indeed did so:
They just grazed the 4% threshold of GDP/6% threshold of consumer spending in April. While Oil prices themselves peaked in April along with nearly everything else, it appeared obvious in January that they would trigger a slowdown or reversal sometime this year.
5. Money supply stalled or shrank
This is another area of confirmation of indicators from the Roaring Twenties and Great Depression. After rising briskly for over a year, at the beginning of this year, real M2 began to decline and real M1 stagnated:
The M2 decline was the chief reason for the tailing off of increases in the index of Leading Economic Indicators. Recessions have typically been accompanied by real M2 growth of less than 2.5%, and real M1 declining. We have the first, which may be turning around now. The second has not occurred.
6. Housing permits and purchase mortgage applications
The MBA's index of purchase mortgage applications peaked last November just before the original expiration date of the $8000 home buying credit. Despite the secondary peak in April, it has been generally in decline since:
Similarly, housing permits peaked in December and again in March. Housing permits have been the second biggest source of the tailing off of the advance in the LEI, and most likely the MBA purchase mortgage index has been the primary source of the steep and sudden decline in ECRI's index. Housing is a classic "long" leading indicator, and on an annual basis, did lead the 1929 decline by several years, and bottom in 1933.
That's my list. These 6 items have shown that they bear further watching (and generally I do in my "Weekly Indicators" wrap-up). If anybody knows of anything else, feel free to add it to the list in Comments.