This was the week we found out that the Great Recession was even "greater" than we thought, and that we went an entire year with an improving GDP making up about 3/4 of the loss. Can we ask the NBER "Are we there yet?"
In addition to the GDP report, monthly reports focused on home sales and, as I pointed out yesterday, show sales (NOT prices) searching for and possibly finding a bottom. Durable goods unexpectedly fell in June, although why it was unexpected given the poor housing and auto numbers is beyond me. Maybe Boeing or the Pentagon didn't give out lollipops?
Turning to our weekly numbers, the Mortgage Bankers' purchase mortgage index rose ever so slightly out of the sub-sub-basement for the second week in a row. Bottoming is better than cliff-diving, and let's hope that's what we've got.
The ICSC reported same store sales for the week ending July 23 rose 3.8% vs. a year earlier, and also rose 0.6% from the week before. For the month of July, same store sales have averaged +3.8% YoY. This is a very good showing. Shoppertrak also reported that sales rose 3.9% for the week ending July 24, and that sales were also up 1.4% from the week before. Taken together, the sales reports for July suggest that retail sales might be picking up again.
Gas prices rose 3 dents to $2.75 a gallon. At a rate of 9.632 million barrels a day, last week showed the highest usage in 3 years. This, along with retail sales, has to be counted as a good sign.
The BLS reported 457,000 new jobless claims this week. This was down a little from last week. This data series continues to be particularly noisy and distorted now, with both the auto plant non-closures and filings by laid off census workers figuring into the mix.
Railfax continued to sound the alarm. Cyclical traffic is declining rapidly to last year's number, and baseline traffic is already there. Only intermodal traffic, signalling imports and exports, is showing a very slight improvement. Motor vehilce loads are cliff-diving, and waste and scrap materials aren't just declining, they are worse than a year ago. Rail traffic argues that the slowdown or double-dip isn't in the future, it is occurring right now.
The American Staffing Association reported that for the week of July 12–18, 2010, temporary employment increased 3.04%, meaning its index rose to 91." The ASA publishes a 5 year historical graph that is particularly telling:
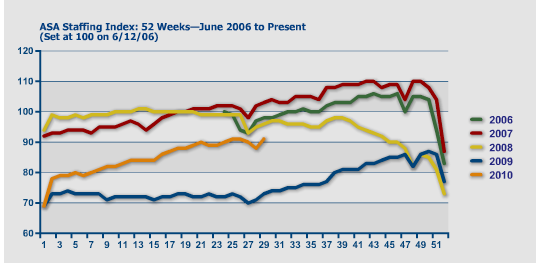
Temporary hiring has increased dramatically in the last year, rising almost to the level of mid-2008 before the crisis occurred. This is a far more substantial move than employment gains in general, and suggests that employers aren't ready to commit to full time employees yet, and may not be for awhile.
M1 was steady this week, which means it remains up 3% on a YoY basis for the month of July so far, is up 3% (meaning “real M1” is up about 2%). M2 is up 0.1% this week, or about 1.9% YoY for July so far (meaning “real M2” is up about 0.8%). Generally the YoY trend in M1 is declining from a very high rate, but the real YoY M2 trend has bottomed and is slowly increasing. To be "out of the woods" in terms of a double dip I would want to see continued positive real M1 and real M2 up more than 2.5%.
I'm going to start to track weekly commercial paper rates, since in deflation these spreads may be better indicators (albeit more coincident than leading) than the yield curve. Weekly BAA commercial paper rates declined slightly to 5.95%. BAA paper rates have generally been declining for the last month or so after spiking during spring. It will be interesting to see how this affects the ECRI weekly number which has gotten so much press recently.
Finally, there continues to be good news in the Daily Treasury Statement. Nineteen reporting days into July, with only two days left, $122.6 B has been collected vs.$115.4 B last year, a gain of over 7%. For the last 20 reporting days, we are also up almost 9%, $130.6 B vs. $120.1 B. (BTW, don't be taken aback if the raw July vs. July comparison doesn't look this good, as there was one more reporting day last year vs. this year). This series has been kicking butt on a YoY basis for the last eight weeks, even with about 400,000 census layoffs having taken place during that time. Something is going on here, because this kind of growth was consistent with +200,000 to +300,000 jobs added a month during the middle of the last economic expansion.
This week the more coincident indicators - rail traffic vs. employment - split strongly. For a change, though, the leading indicators favored the economic bulls.