As seasoned market watchers know, the price to earnings ratio, or p/e, is a measure of enthusiasm for stocks. It indicates how many dollars someone is willing to pay for a dollar of earnings. When stocks are out of favor, the p/e ratio might be in single digits. On the other hand, when stocks are a "can't lose" bet as they were in 1929 or the late 1990s, the p/e ratio might go to 18 or 20 or even higher.
Because this enthusiasm, or lack thereof, plays out over long periods of time - perhaps a generation or more - it takes a long time for the secular p/e ratio to cycle from bottom to top and visa versa.
This brings us to a series of graphs that indicate that we are reaching a watershed of sorts. First of all, from Crestmont Research via The Big Picture, here is a graph of the p/e of the S & P 500 over the last 100 years:
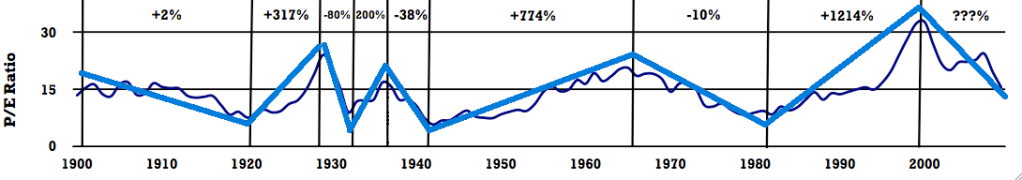
If past long term cycles repeat this time, there is a time in the very near future when once again, large cap stocks will be valued at single-digit multiples of their earnings.
With that in mind, now let's turn to Prof. James Hamilton of Econbrowser, citing Yale University Prof. Shiller, who
relates the current inflation-adjusted stock price to the previous ten-year-average of inflation-adjusted earnings. Despite the recent correction in stock prices, stocks still cost more today relative to the earnings you're buying than they did over most of the previous century and a half. We'd still need about another 17% decline in stock prices to get back to the historical average valuation multiple.
One reason that might be worth paying attention to is the following graph, whose blue line shows the annual rate of return you would have earned by buying stocks at any indicated date and holding on to them for the next decade. The green line (the price-earnings multiple) you would know at the indicated date, whereas the blue line (the return on stocks over the next decade) you wouldn't know until 10 years after the indicated date. What is pretty clear in hindsight is that those dates at which stocks were very richly valued turned out to be terrible times to buy:
Furthermore, Prof. Hamilton notes that
A buyer of stocks today is usually getting a higher immediate yield than on TIPS, in addition to prospects of future dividend growth. Just as they did in the 19th century, stocks as priced today should give you a significantly better return than bonds.
The short version of what these two items are telling us is:
(1) we are not far above the point where buying stocks has been an excellent investment over a 10 year period, and in particular compared with bonds; and
(2) if the present trend in p/e compression continues, as it has in previous secular cycles, that point will be reached very soon.
So what is the little guy, the Main Street small investor doing? Take a look at this graph:
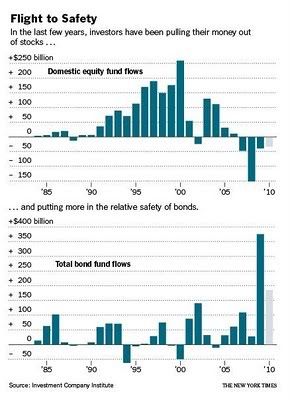
As noted in this L.A. Times story, s/he is getting out of stocks in a big way, and piling into bonds that are currently yielding about 3%. The above graph shows yearly cash flows. While I can't show you their weekly graph, Barron's mutual fund cash flows show that investors have pulled $4.9 Billion a week out of stock mutual funds in the last four weeks, continuing similar outflows that have gone on for months - including $5.6 Billion in June, and $10.4 Billion in July. At the same time, they have put almost the exact same amount into bond funds. This means it is not a matter of hardship withdrawals due to economic distress.
In short, while undoubtedly some individuals are in distress, in the aggregate the public is pulling out of stocks and piling into bonds.
Please note, I'm not saying we are at a bottom, or that stocks are about to take off on a secular bull market. I am one who believes that we still have somewhere between 2-7 years left in a secular bear market. Last year's DJIA 6500 may or may not have been the absolute bottom, but if not there will be at least one more very bad day out there before the end of this secular market that will at very least rival that buying opportunity.
Please note, I'm not saying we are at a bottom, or that stocks are about to take off on a secular bull market. I am one who believes that we still have somewhere between 2-7 years left in a secular bear market. Last year's DJIA 6500 may or may not have been the absolute bottom, but if not there will be at least one more very bad day out there before the end of this secular market that will at very least rival that buying opportunity.
The bottom line is that the time is near when a single digit p/e coupled with absolute value closer to the bottom than the top of the last 10 years of asset prices will richly reward a disciplined program of long-term averaging into stocks. The small investor has chosen this exact moment to give up on stocks and chase bonds.
In other words, Main Street is still the "dumb money."
In other words, Main Street is still the "dumb money."