


Manufacturing activity expanded further on balance, although the pace of growth appeared to be slower than earlier in the year. Most Districts reported further gains in production activity and sales across a broad spectrum of manufacturing industries. However, New York, Richmond, Atlanta, and Chicago noted that the overall pace of growth slowed, while Philadelphia, Cleveland, and Kansas City reported that demand softened compared with the previous reporting period. Recent weakness was most notable for construction-related products, according to reports from Cleveland, Richmond, Chicago, Dallas, and San Francisco. By contrast, orders and activity edged up for makers of steel and other metals in Cleveland, Chicago, and St. Louis, propelled largely by demand from the transportation equipment industry. Activity among automobile makers and parts suppliers rose further in Richmond and held steady in Chicago, although it dropped temporarily in Cleveland as a result of factory retooling. Manufacturing activity for commercial aircraft was steady in the Dallas and San Francisco Districts, although a contact in Boston reported that the industry's recovery has been slow. In the Boston and San Francisco Districts, makers of semiconductors and other high-tech products saw further sales gains, while Dallas noted that demand held largely steady at existing high levels. Among nondurable products, food processing stepped up in Philadelphia and San Francisco. Demand conditions for paper products were mixed, with increased sales and expansion plans noted in Minneapolis and St. Louis but flat to declining sales identified in Dallas. Export demand was an important contributor to healthy conditions in the manufacturing sector according to Boston and Chicago, notably for heavy machinery and autos.Reports on capacity utilization were mixed. Manufacturers of high-tech products have been operating near maximum capacity of late, although this partly reflects a substantial decline in industry-wide capacity over the past three years, as noted by Dallas. More generally, the majority of Cleveland's manufacturing contacts reported that capacity utilization remained below pre-recession levels. Capital spending plans for manufacturers and firms in other industries generally indicate little change or modest increases in coming months, based on reports from the Boston, Philadelphia, Cleveland, Chicago, Kansas City, and San Francisco Districts.
Before we look at the regional reports, here are some takeaways from the previous points.
1.) The weakness in the housing markets appears to be a prime reason for the recent drop in manufacturing numbers.
2.) Auto and semi manufacturing appears to be in good shape
3.) Paper is mixed. This is a manufacturing sector that applies to all manufacturers, as everybody uses paper in one form or another.
4.) Aircraft manufacturing is fair.
5.) Exports are a a big source of demand.
Let's look at the regional reports:
Boston: Nearly all manufacturing firms surveyed report favorable results for the second quarter. Demand is particularly strong at semiconductor and pharmaceutical firms. One respondent from a long-standing business describes the second quarter as their best ever. In contrast, a parts supplier for the aircraft industry says that demand has been slow to recover from the recession. Sales held steady in recent weeks among many contacted manufacturers; multiple respondents attribute recent demand to booming business in northern and western Europe. The same firms describe domestic sales as flat in comparison. In addition, several diversified manufacturers and one large domestic industrial manufacturer all note that sales leveled off in recent weeks relative to the first half of the year.NY: Manufacturing firms in the District report some leveling off in conditions in July and August, after reporting fairly widespread improvement during the first half of the year. However, a sizable number of manufacturing contacts indicate that they are increasing employment.
Philly: Third District manufacturers reported slight decreases in shipments and new orders from July to August, on balance, as well as a decrease in order backlogs. Slower activity was reported in most of the major manufacturing sectors in the District. However, producers of wood products, food products, industrial materials, and measuring and testing equipment reported increased demand for their products.
Cleveland: Reports from District factories show that production levels were mainly steady or down slightly during the past six weeks. Changes in new orders mirrored those in output. Production was higher on a year-over-year basis, with several contacts citing double-digit increases. A large majority of respondents expect output will stay at current levels for the near term. Those anticipating a drop in production attributed it primarily to seasonal factors or the continuing slump in residential construction. Most steel producers and service centers reported that volume was stable or increasing. Shipments are being driven by energy-related, auto, and heavy equipment industries. Construction volume remains weak.
Richmond: District manufacturing activity continued to expand in late July and August, but some sources indicated a slowdown in demand over the last month. A chemical manufacturer commented that new equipment was being installed at his company with the expectation that the economy would continue to grow. Moreover, a packaging manufacturer informed us that demand was stronger at his company, and a parts supplier indicated that raw material inventories had decreased and his suppliers were having a hard time keeping up with demand at his firm. He added that his company was working Saturdays to meet demand and that inventories of finished goods remained below desired levels. A majority of survey respondents reported that shipments, new orders, and employment continued to grow, but at a slower pace than a month ago. Some declines were reported; for example, a manufacturer of exterior doors for residential housing said that all activity had ground to a halt in the building products industry. He noted that the slowdown started in May and continued through August.
Atlanta: Manufacturing contacts reported that overall activity was expanding, but at a slower pace than in the previous report. Fewer District manufacturers noted increases in new orders, and more said that orders were lower.
Chicago: Manufacturing production growth slowed from the previous reporting period. Contacts indicated it was difficult to gauge the extent of the recent softening as July and August, in general, tend to be slower. In a positive sign, several metals manufacturers indicated that orders and inquiries had begun to firm in recent weeks. Manufacturers of construction materials and household goods reported declines in shipments, with the exception of household appliances where inventory continued to be rebuilt in the aftermath of the recent rebate programs.
St. Louis: Manufacturing activity has continued to increase since our previous report. Several manufacturers reported plans to open plants and expand operations in the near future, while a smaller number of contacts reported plans to close plants and reduce operations. Firms in the soap and cleaning compound, aerospace products and parts, glass products, motor vehicle parts, and primary metal manufacturing industries reported plans to open new facilities in the District and hire employees. Contacts in the food, engine, adhesive, and sanitary paper products manufacturing industries reported plans to expand existing facilities and operations. In contrast, firms in the furniture, hand tool, and power transmission equipment manufacturing industries announced plans to decrease operations and lay off workers.
Minneapolis: Manufacturing output was up since the last report. A July survey of purchasing managers by Creighton University (Omaha, Neb.) showed strong increases in manufacturing activity in Minnesota and South Dakota, and slight increases in North Dakota. A drainage pipe maker is opening a plant in South Dakota. In Minnesota, two new solar energy component manufacturing facilities are planned. In the Upper Peninsula of Michigan, a coated paper company noted an increase in orders over the past two months from earlier this year and last year.
KC: Manufacturing activity slowed in late July and August, while other business activity continued to expand. Factory production was flat compared to previous months, while shipments and new orders weakened. A producer of chemicals said distributors were only placing orders for product as needed and were unwilling to bring in inventory due to high levels of economic uncertainty.
Dallas: Most producers of construction-related materials--including brick, lumber, cement, glass and primary and fabricated metals--said conditions remained weak. Several respondents tied to housing construction said orders were especially low in July because of the vacuum created by the end of the tax credit. Contacts that produce products used in nonresidential construction noted most activity was related to public projects. Outlooks were slightly more pessimistic than in the last report, with several contacts expecting no turnaround until 2012. A primary metals producer that sells to transportation manufacturers was more upbeat and expects increased orders in coming months.
Manufacturers of high-tech products said demand held steady over the past six weeks. Growth in orders has leveled off in recent months after a replenishment of inventories earlier in the year that drove very strong growth. Most respondents characterize current order levels as good. Although inventories have increased, respondents said they are relatively lean and in some cases below desired levels. Several semiconductor contacts said that industry-wide capacity has fallen about 30 percent over the past three years and, even with growing capital expenditures, capacity utilization is likely to remain very high for the next two to three years. Outlooks were positive for the remainder of the year.
Paper manufacturers reported flat to declining sales over the past six weeks. Contacts said customers are very cautious about keeping inventories, due to pessimistic economic outlooks. Growth in demand for food products stalled since the last report. Respondents said they did not see the normal summer boost this year.
Non-defense aircraft manufacturers said orders held steady over the past six weeks and are above year-ago levels. Outlooks were cautiously optimistic. Trailer producers said demand had fallen as uncertainty about the national economy increased. Sales are expected to be slow through year-end.
Petrochemical producers were mostly optimistic, noting domestic orders were strong and growing. Export growth was positive but slower, as current prices were less competitive in Europe and Asia. The only reported weakness was for vinyl products used in housing and commercial construction. Refiners noted weaker conditions as seasonal gains in gasoline consumption did not materialize and distillate (diesel and heating oil) consumption slipped back. Contacts expect a decline in capacity utilization rates and refining runs due to weaker margins.
SF: District manufacturing activity generally continued to grow during the reporting period of mid-July through the end of August. Demand strengthened further for manufacturers of semiconductors and other technology products, with high levels of capacity utilization and balanced inventories noted. While new orders remained limited for makers of commercial aircraft and parts, extensive order backlogs kept production rates near capacity limits. Activity at petroleum refineries rose in response to increased demand, although inventories remained at elevated levels. Food manufacturers reported further growth in sales. By contrast, demand for wood products deteriorated, reportedly as a result of a slowdown in new home construction as well as residential repair and remodeling activity.
The above anecdotal information paint a picture of a slowing manufacturing sector.
Here are some charts of the various regions manufacturing indexes:

The Texas index is right around 0.
The Richmond Fed's index is still positive.


The Empire State index (above) is still positive, but recent readings make it just so.
Also consider these macro level charts:

Overall industrial production continues to increase, as does

capacity utilization.
Finally, let's look at the latest ISM Manufacturing index. This was released on September 1 and the Beige Book covered the period before August 30.
"Manufacturing activity continued at a very positive rate in August as the PMI rose slightly when compared to July. In terms of month-over-month improvement, the Production and Employment Indexes experienced the greatest gains, while new orders continued to grow but at a slightly slower rate. August represents the 13th consecutive month of growth in U.S. manufacturing."And finally, here is the chart:Eleven of the 18 manufacturing industries are reporting growth in August, in the following order: Primary Metals; Apparel, Leather & Allied Products; Transportation Equipment; Fabricated Metal Products; Electrical Equipment, Appliances & Components; Miscellaneous Manufacturing; Computer & Electronic Products; Paper Products; Chemical Products; Food, Beverage & Tobacco Products; and Printing & Related Support Activities. The five industries reporting contraction in August are: Furniture & Related Products; Petroleum & Coal Products; Nonmetallic Mineral Products; Plastics & Rubber Products; and Machinery.
What respondents are saying:
- "Still experiencing intermittent delays in electronic components due to capacity and raw materials." (Electrical Equipment, Appliances & Components)
- "International sales are especially strong. Domestic business is solid." (Chemical Products)
- "Orders and business still strong." (Primary Metals)
- "Order rate has slowed some. Supplier capacity in general seems to be improved." (Machinery)
- "Large customers reducing pull rates for production." (Computer & Electronic Products)

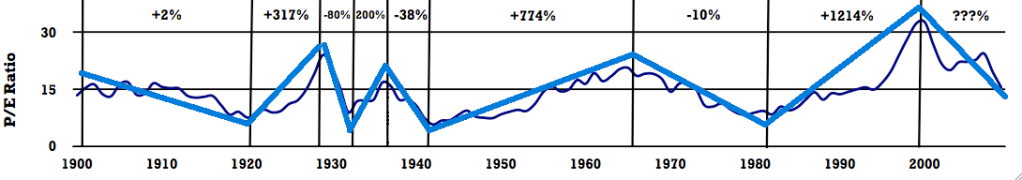
relates the current inflation-adjusted stock price to the previous ten-year-average of inflation-adjusted earnings. Despite the recent correction in stock prices, stocks still cost more today relative to the earnings you're buying than they did over most of the previous century and a half. We'd still need about another 17% decline in stock prices to get back to the historical average valuation multiple.
One reason that might be worth paying attention to is the following graph, whose blue line shows the annual rate of return you would have earned by buying stocks at any indicated date and holding on to them for the next decade. The green line (the price-earnings multiple) you would know at the indicated date, whereas the blue line (the return on stocks over the next decade) you wouldn't know until 10 years after the indicated date. What is pretty clear in hindsight is that those dates at which stocks were very richly valued turned out to be terrible times to buy:
A buyer of stocks today is usually getting a higher immediate yield than on TIPS, in addition to prospects of future dividend growth. Just as they did in the 19th century, stocks as priced today should give you a significantly better return than bonds.


Reports on consumer spending were mixed but suggested a slight increase on balance. Most Districts reported that non-automotive retail sales rose compared with the previous reporting period or were above their levels from 12 months earlier. By contrast, Atlanta reported a decline in the level of sales, and Richmond noted that sales "sputtered" in August, while New York and Dallas reported that growth in retail sales slowed. Several Districts noted an emphasis on necessities and lower-priced goods. Boston reported that back-to-school purchases were focused on immediate needs; in Cleveland, consumers focused on "value-priced seasonal items;" and in St. Louis, Kansas City, and San Francisco, sales were relatively stronger for lower-priced items. Spending on big-ticket items such as expensive consumer electronics was weak according to Philadelphia, Richmond, and Dallas. Most Districts also reported that sales of new automobiles and light trucks were largely stable or up slightly during the reporting period, and contacts were optimistic for stable sales or slight growth over the balance of the year. A few reports indicated that inventories for various goods remained near desired levels despite slower sales in some cases, as retailers have been practicing very tight inventory management.
Boston: First District retailers report mixed sales results for July and early August. Year-over-year same-store sales range from decreases of 10 percent to increases in the low single-digits, and one contact quips that "flat is the new up." Back-to-school sales were modest, with the consumer focused on buying for immediate needs only. Several retailers report increases in foot traffic but also smaller average ticket size.
NY: Non-auto retailers report that sales have slowed across the District since the last report, with comparable-store sales running just 2-3 percent ahead of a year earlier, on average, in July and up just 1-2 percent in the first few weeks of August. The slowing has been particularly pronounced at New York City stores. Two major shopping malls in western New York State also report that sales weakened in July through early August, and they report substantial discounting--especially at clothing retailers.
Philadelphia: Third District retailers reported that sales rose from July to August for the back-to-school shopping period, and most of the stores surveyed posted year-over-year gains for the period. Store executives continued to note that much of the year-over-year improvement in sales has been a consequence of last year's poor results; nevertheless, many said the fundamental trend in sales was beginning to strengthen. Some merchants noted relatively healthy sales of apparel and small appliances, albeit with significant discounting, but weak sales of big-ticket consumer electronic products.
Cleveland: For the period from mid-July through mid-August, retail sales generally showed some improvement when compared to the previous 30-day period. Purchases rose slightly on a year-over-year basis. Still, consumers remain cautious in their purchases and are focusing on value-priced seasonal items.
Richmond: Retail sales sputtered in August, with most merchants reporting either flat or contracting activity. Sales declined at several building supply businesses as well as lawn and garden retail establishments. An executive at a hardware store chain in central Virginia commented that sales were flat, and he had redistributed inventory across store locations as part of an ongoing cost reduction plan to survive the weak housing market. The store manager for a discount chain store in central North Carolina reported erratic apparel sales; however, he and several other retailers were relieved that early results from back-to-school sales on other items were at least satisfactory.
Atlanta: Most District merchants reported that traffic and sales decreased in July and August. Retailers continued to keep inventory levels low and the outlook was less positive than in previous months. District automobile dealers indicated that sales increased from a year ago.
Chicago: Consumer spending increased from the previous reporting period. Retail sales excluding autos were up in August influenced by state sales tax holidays and heavy discounting on back-to-school items like clothing. Contacts noted that higher and lower-end retailers fared well, with middle-end retailers continuing to see customers trading down to lower priced alternatives.
St. Louis: Retail sales reports from contacts in July and early August were mixed. Compared with a year ago, about 37 percent of the retailers saw increases in sales, while 42 percent saw decreases and 21 percent saw no changes. About 32 percent of the respondents noted that sales levels met their expectations, 47 percent reported that sales were below expectations, and 21 percent reported that sales were above expectations. Higher-priced items continued to be weak sellers.
Minneapolis: Retail spending increased moderately. A major Minneapolis-based retailer reported that same-store sales in July were up 2 percent compared with a year earlier, and a Minnesota-based restaurant chain reported that recent sales increased moderately compared with a year ago. July sales at two Minneapolis area malls were above year-ago levels, and mall traffic seemed to hold steady during August. A retailer in Montana noted that sales for appliances and electronics were up about 10 percent compared with a year ago. In southwestern Montana, a furniture store reported that recent sales increased; however, sales at a lumber and home improvement retailer were down.
KC: Consumer spending rose modestly from the previous survey, and contacts expected further growth in the months ahead. Retail sales edged higher and were above year-ago levels at a majority of stores and malls. Purchases of energy-saving appliances and clearance items were reported as strong at several stores, while sales of luxury items such as jewelry and dining room sets were generally characterized as weak.
Dallas: Retailers noted that growth has slowed recently, but sales are up on a year-over-year basis. Customers continue to focus on non-discretionary items while shunning big-ticket purchases. Eleventh District sales trended slightly above the nation over the reporting period, a change from the previous report. Outlooks suggest that while sales growth may be slower for the remainder of the year; overall 2010 sales should show positive single-digit growth.
San Francisco: Retail sales were mixed. Traditional department stores and discount retail chains alike reported further sales increases for small household items, with generally balanced inventories noted. By contrast, sellers of major appliances and furniture reported a slowdown and "difficult" conditions in July and August.


NY: Auto dealers in the Rochester area report that sales of new autos were down roughly 10 percent from a year ago in July and down 15 to 20 percent in the first half of August, while Buffalo-area dealers report a 5 percent year-over-year increase in July and project a moderate decline in August. Still, contacts in both areas describe the current sales pace as fairly good, with the 12-month comparisons depressed by last summer's "Cash for clunkers" program. Dealers report that both retail and floor-plan credit conditions have continued to improve.
Philadelphia: Third District auto dealers reported roughly steady sales during July and August at a rate somewhat above the year-ago pace. Dealers expect sales to continue to run at about the current rate for the rest of the year. However, some dealers said manufacturers' incentives are supporting sales of current model-year vehicles, and sales could slip when that supply is depleted and replaced by new model-year vehicles.
Cleveland: Auto dealers saw new vehicle sales strengthen from mid-July through mid-August, when compared with the previous 30 days. Reports also showed improving sales on a year-over-year basis. Expectations call for vehicle purchases to stabilize at current levels in the upcoming months. Many dealers continue to say that their inventories are at low levels. Used vehicle purchases are beginning to soften
Richmond: Big-ticket sales remained weak, according to several contacts. A car dealer in the Tidewater area of Virginia and another in the South Carolina Piedmont indicated that their dealerships were seeing gradual improvement. However, contacts at other dealerships reported a slowdown in sales.
Atlanta: District automobile dealers indicated that sales increased from a year ago.
Chicago: Auto sales rose in July as increased incentives spurred demand, but sales leveled off in August. Dealers continued to report that inventories were lower than desired, particularly for the most popular Ford, GM, and Chrysler models.
St. Louis: Car dealers in the District reported that, compared with last year, sales in July and early August were up, on average. About 44 percent of the car dealers surveyed saw increases in sales, while 32 percent saw decreases and 24 percent saw no changes. Just under half of the car dealers noted that used car sales had increased relative to new car sales, while 12 percent reported the opposite. Also, 20 percent reported more acceptances of finance applications, but 12 percent reported more rejections.
Minneapolis: Vehicle sales were up slightly in North Dakota, according to a representative of an auto dealers association. The owner of a Minnesota domestic auto dealer said that August sales were up from a year ago, but corporate customers were more cautious about purchases.
KC: Auto sales also increased slightly from the previous period, and nearly all dealers were optimistic about future sales. Auto inventories continued to decline, and some dealers were concerned about meeting expected demand as a result.
Dallas: Automobile demand held steady over the reporting period. Contacts said inventories are at appropriate levels and manufacturers are incrementally increasing production. Expectations are for continued modest improvement.
San Fran: Sales of new domestic and imported automobiles improved near the beginning of the reporting period but slowed subsequently. Used vehicle sales improved marginally, while dealers faced a limited supply that kept inventories tight.


Among the 30 companies in the Dow Jones Industrial Average, the 10 that get the largest share of their sales abroad are expected to see revenues grow by an average of 8.3% over the next year, industry analysts say. By contrast, the 10 that do the least business outside the U.S. are likely to show average revenue gains of just 1.6%.
.....The divergence between domestic and foreign-oriented business affects the larger U.S. economy in a number of ways. At a time when unemployment remains stubbornly high, many export-oriented manufacturers are struggling to find skilled workers, while jobs that once served as a safety net for American workers, like retailing jobs, have few openings.
If the trend continues it could also drive an even larger wedge between the fortunes of highly educated workers and those with less education.
Rather than simply meeting rising demand abroad by stepping up their exports from the U.S., companies are increasingly moving production to where they sell their products—especially in developing markets, where labor costs are far lower.
This expansion abroad doesn't create any "routine" jobs at home, like working on an assembly line, says Ann Harrison, an economist at the University of California, Berkeley. But workers engaged in more specialized areas, such as research and development, which aren't as easy to move abroad, tend to benefit.
"The workers in the U.S. who are designing the goods, who are coming up with the marketing campaigns—those workers are better off," Ms. Harrison says.
This article highlights a couple of very interesting points.
1.) Over the last few weeks, we've seen strong growth rates printed in foreign economies. Brazil is growing at an 8.9% rate. Germany is also growing along with China. These markets are where the multi-national companies are. However, the US is growing slowly, making it a far less attractive market. Both New Deal Democrat and I have argued the US economy is now the global caboose. These figures bear that out.
2.) Consider this chart from Calculated Risk

Click for a larger image.
Notice that higher educational levels have a lower unemployment rate. Expect this trend to continue, especially as the US becomes less and less of a muscle jobs economy and more of a thinking jobs economy.
I recently made a presentation to my dissertation class where I made the following point: use your dissertation to create a unique, niche specialty for yourself, such that you will be one of the only people in the market to have that specialty. Then use your dissertation to publicize yourself. That is the way the US economy is moving; it is therefore imperative for the economy to invest heavily in education and make it affordable.
3.) There is a lot of political hay made of outsourcing. Some of this in understandable; moving jobs to a new location while having those jobs leave the US is obviously a politically painful situation. However, there is also the issue that as foreign markets develop and become mature, businesses simply move their operations to new locations to build markets in those new locations. Like it or not, that is how business works.


One-quarter of the 599,893 bridges in the United States have structural problems or outdated designs. The country can do more than rebuild these bridges—we can make them better, using high-performance concrete, steel and composites; automated monitoring systems to watch for deterioration; and smarter designs. Similar technologies can also be employed on highways, tunnels and other structures.
.....
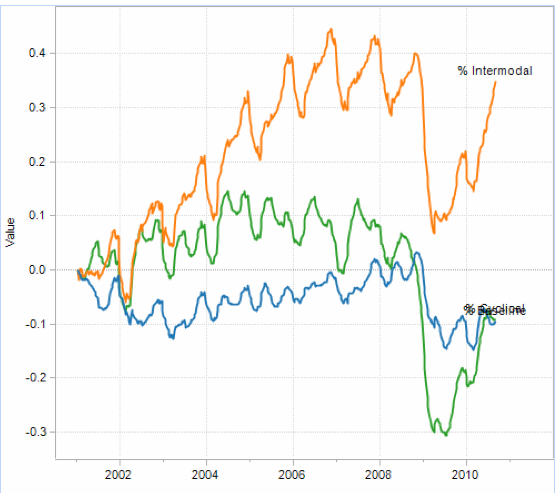
About 28.9 million shipping containers passed through crowded U.S. ports last year, and gridlock is mounting. Containers entering the country languished on docks an average of seven days. Adopting the “agile port system” now being developed with help from federal agencies would boost efficiency. When the concept was tested at Washington’s Port of Tacoma, it cut cargo delays in half.
The projects are no[t] economically viable. They don't create any new wealth. When the old bridges are torn down (many still work just fine) and new ones are built, hundreds of billions of dollars would have been spent and all that will need to be paid back with interest, and the much of the spending would have drifted out of the US in the form of imports and higher commodity prices.
Better policy options would be the elimination of the corporate tax for all domestic manufacturing operations and the elimination of the payroll tax altogether (social security will be paid for in the short term from the general fund).
The interstate highway system made less expensive land more accessible to the nation's transportation system and encouraged development.
The travel time reliability of shipment by interstate highway has made "just in time" delivery more feasible, reducing warehousing costs and adding to manufacturing efficiency.
By broadening the geographical range and options of shoppers, the interstate highway system has increased retail competition, resulting in larger selections and lower consumer prices.
By improving inter-regional access, the interstate highway system has helped to create a genuinely national domestic market with companies able to supply their products to much larger geographical areas, and less expensively.