In my last couple of posts, I discussed how the recovery in manufacturing is giving us very few jobs relative to the strength of thats recovery, compared with 1946-1983 recoveries, to the tune of close to 1,000,000 jobs.
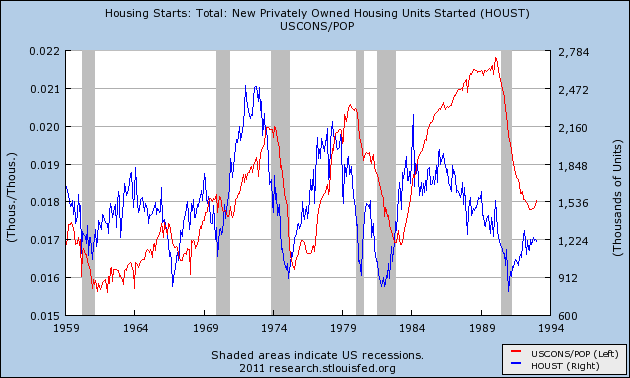
In contrast, let's look at construction. There first couple of graphs look at housing starts (blue) vs. construction jobs (both residential and non-residential), in the 1948-1983 period:
and for the last two recessions and recoveries:
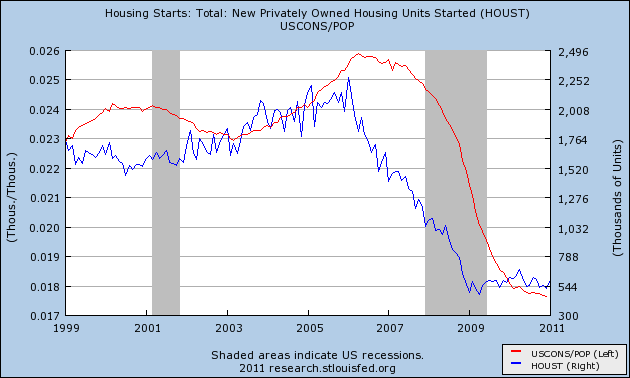
Note that construction jobs lag housing starts by about 1 year, a pattern that continues now. (Also note, in the above graphs I divided construction jobs by population, to give the percentage of people working in construction, for ease in viewing purposes only).
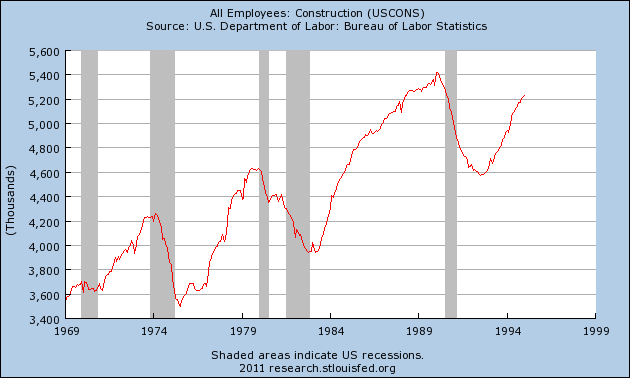
Now let's take out housing starts, and look at the change in raw numbers in construction jobs during recoveries. Here are the post-World War 2 recoveries:
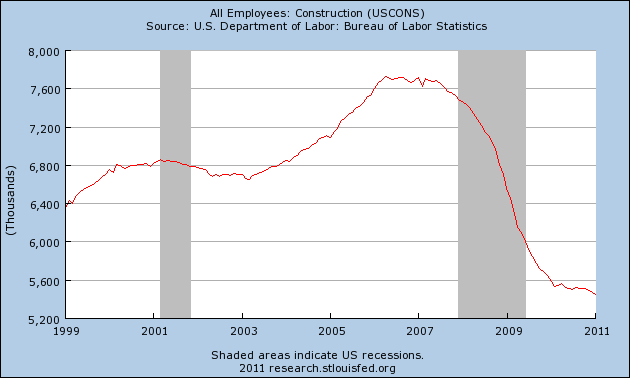
And here are the last two recessions and recoveries:
In the post-war period, about 200,000 construction jobs were added per year once growth started. None at all were added after the dot-com bubble until the housing bubble caused about 250,000 a year to be added.
By contrast, with the crash in the housing market, that has been limping along a bottom for 2 years, construction jobs are still being lost, albeit very slowly.
So, not only is the current boom in manufacturing failing to create many jobs in comparison with past booms, causing a population-adjusted shortfall of perhaps 1,000,000 jobs; but the continuing housing bust is costing another shortfall of 200,000 or more jobs.
That leaves the private and government service sectors to pick up the slack. We know the public sector is bad. I'll discuss the ISM non manufacturing report later.