Permabulls and permabears constantly change the data they highlight in order to justify their already-held conclusion. One way I try to keep myself honest is to look at the same data-sets over and over again - something I do every week in my "Weekly Indicators" posts. With the temporary lull in dramatic (US) economic direction, I am updating a number of metrics I haven't looked at in awhile. Last week, I looked at leading indicators for jobs.
In this post, I am updating two related series that in the past have been leading data for GDP: real wages and personal savings. It's a good thing I didn't wait much longer, because in the last few months, both have taken a turn for the worse.
Prof. Paul Krugman has been alarmed by the decline in wage growth for some time. In the last few months the situation has worsened. This is average earnings for nonsupervisory workers, which is part of the monthly employment report:
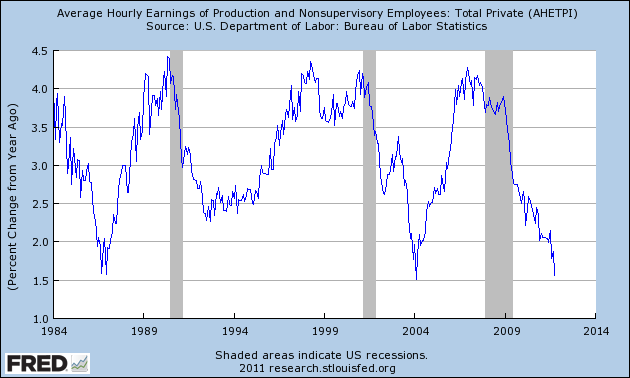
Note that while YoY% wage increases have rapidly declined from 2% to 1.5% in the last few months (note: median wages would be a more accurate measure, but they are only updated quarterly), this graph does not suggest alarm -- in the past YoY% wage increases have made a trough if anything in the middle of economic expansions.
This next graph, however, adjusts wage growth for inflation, to give us "real average hourly wages" and this tells a different story:
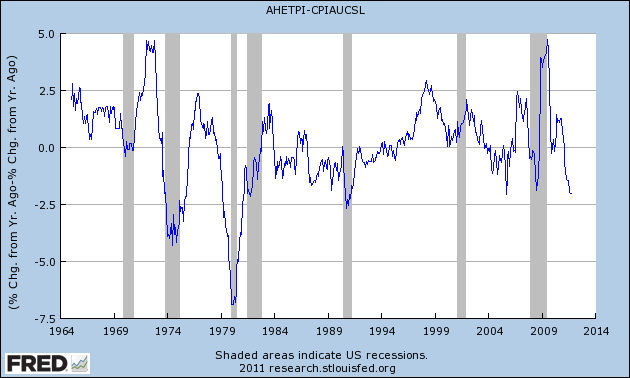
Every recession in the last 50 years has been preceded by or coincided with a significant decline in real wage growth. The more significant the decline, the more likely it presages a recession. Further, with the exception of 1987 and the peak of the housing bubble, every time YoY wage growth has turned as negative as it is now, a recession has followed.
One reason that negative YoY real wages haven't always led to a recession is their interaction with interest rates, in particular mortgage rates, as shown in this next graph, which overlays 30 year conventional mortgage rates in red:
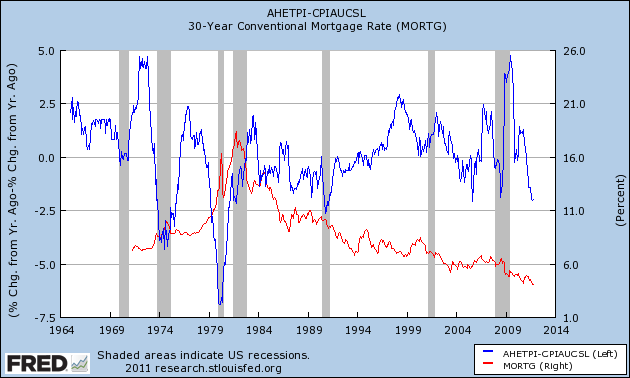
Real wages actually declined throughout the 1980's, but interest rates consistently declined - from 20% to 10%! - until 1987, allowing mortgages to be refinanced at lower and lower rates. It was only after interest rates failed to decline further for a period of 3 years that a recession was triggered in 1990. Similarly the interest rate declines of the early 2000's helped fuel the housing bubble despite real wage declines in the middle of the decade.
Here is a close-up of the same information for the last 10 years:
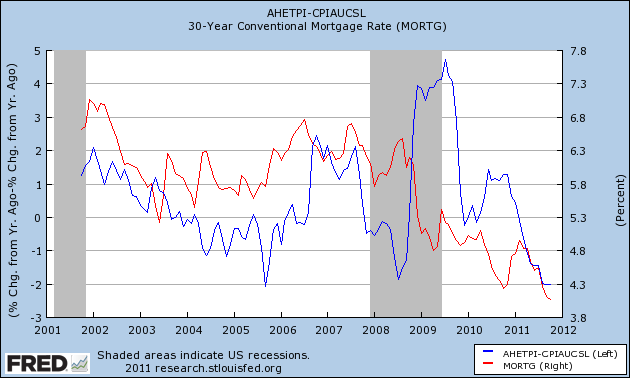
Interest rates have declined further since the onset of the "great recession", from 6% to under 4%, allowing more refinancing. Whether this is enough to offset the decline in real wages is questionable, and certainly cannot go on for more than several years.
Now let's turn to personal savings and the savings rate.
Personal savings are the "fuel" that supplies the consumption that is 2/3's of the US economy. The best way to look at this data is to norm for inflation, to give us "real personal savings" which is shown in this graph:
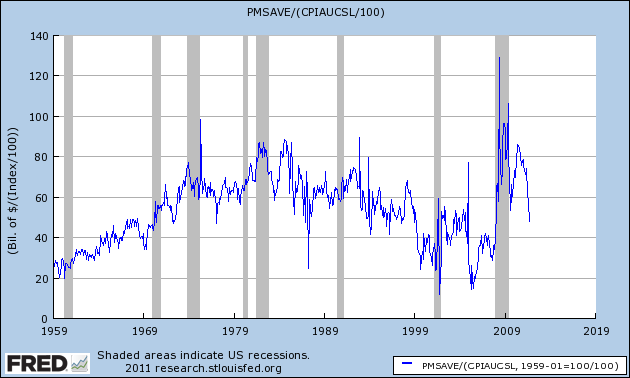
One reason we have not had any "double dip" is because of the enormous amount of fuel that was stockpiled during and immediately after the "great recession." In the last year, however, much of this fuel has been spent, primarily on higher energy costs.
In the past, I found that the "real personal savings" rate - that is, the savings rate as compared with the inflation rate - was a noisy but important long leading indicator for GDP. This next graph shows the "real personal savings rate" by itself:
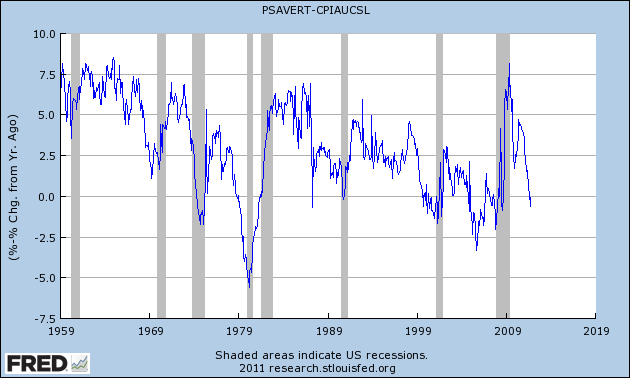
With the same exceptions of 1987 and the housing bubble, a steep decline in the real personal savings rate has always presaged the outset of recessions.
Now let's overlay real GDP data, in red:
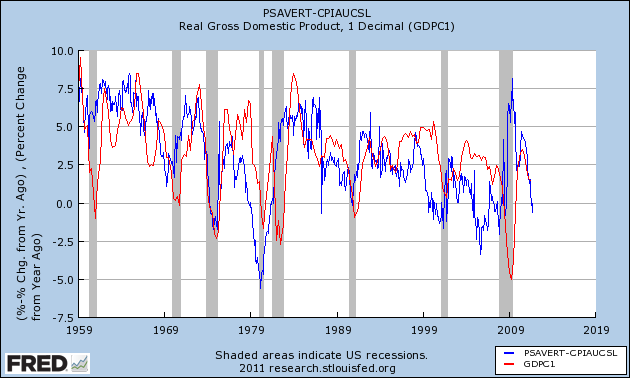
While the relationship is noisy, you can see that the real personal savings rate generally leads real GDP by a period of 6 to 18 months. That real personal savings are now negative is an important recession warning in that time frame.
In general, the above two sets of data suggest to me that consumers, who had accumulated a lot of "fuel" in 2008 and 2009, have been spending it to make up for declining real wages. This is one reason that retail sales have consistently held up so well this year in the face of low wage increases and high gasoline prices. This stockpile, however, has now mainly been spent. Unless refinancing due to lower interest rates is sufficient to free up more disposable income (hence yellow flags rather than a red flag), there will likely be another consumer retrenchment, and thus another recession, at some point in the next 18 months.