- by New Deal democrat
The big monthly news this week was the continued advance of the Leading Economic Indicators for March, up 0.4. February was revised upward to up 1.0. The LEI was greatly helped by the strong monthly rebound of housing permits from February to March, and strong vendor deliveries in the ISM manufacturing survey, showing that manufacturing remains on a tear, and is powering the recovery. Similarly, the Philly Fed survey declined from stratospheric levels last month, but was still showing strong expansion. Other housing data - starts and existing home sales - also bounced strongly higher from February's poor readings.
Will strong manufacturing and associated exports help the US overcome the renewed Oil shock? Will there be a slowdown, or something worse? That's where we are now.
Turning to the high-frequency weekly indicators:
Oil finished the trading week at $112.29 a barrel, the sixth full week it has been above $100. It remains at a level above 4% of GDP. Gas at the pump increased $.05 more to $3.84 a gallon. In the last 6 months, gas prices have gone up over $1 a gallon. Gasoline usage at 9062 M gallons was 1% lower than last year's 9152. This YoY comparison has been negative for the last six weeks in a row, averaging -1.5% for the last four weeks. If this level of decline continues for another month or so, that will be equivalent to the decline near the end of 2007.
The BLS reported that Initial jobless claims last week were 403,000. The four week average has gone back up to 399,000, This series has not made a new low in seven weeks, and has been back over 400,000 for two weeks in a row.
Railfax was up 3.9% YoY. Baseline traffic is still barely ahead of last year's levels. Cyclical traffic's advance over last year is holding even. Only intermodal traffic (a proxy for imports and exports) continued significantly higher last week. Waste materials continued below last year's levels and shipments of motor vehicles continued well ahead of last year's pace.
The Mortgage Bankers' Association reported an increase of 10.0% in seasonally adjusted mortgage applications last week, to a level last seen in December 2010. Because this may have been due to special factors, expect a similar decrease next week. In general this series has meandered in a range since last June. Refinancing increased 2.7%, and remains near its June-July 2010 lows. But neither series is in a long term decline any more.
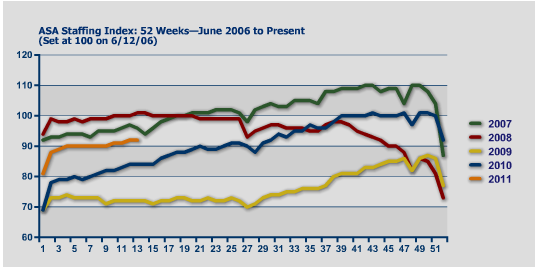
The American Staffing Association Index remained at 92 for the third week, after stalling at he 90-91 level for 7 weeks. So far this year this series' slow progress is similar to that of 2007 and 2008.
The ICSC reported that same store sales for the week of April 2 rose 3.0% YoY, and increased 0.3% week over week. Shoppertrak reported a meager 1.4% YoY increase for the week ending April 16. It also reported a WoW decline of 2.1%. Calendar affects (Easter week this year vs. last year) continue to strongly affect these results, but the Shoppertrak result in particular is not what one would expect getting closer to Easter. This is the first hint in these series of any fallout from $100+ Oil.
Adjusting +1.07% due to the recent tax compromise, the Daily Treasury Statement showed that for the first 14 days in April 2011, $105.5 B was collected vs. $96.6 B a year ago, for an increase of $8.9 B YoY. For the last 20 days, $133.7 B was collected vs. $126.9 B a year ago, for an increase of $6.8 B, or 5.4%. I suggest using this series with extra caution, because the adjustment for the withholding tax compromise is only a best guess, and may be significantly incorrect.
Weekly BAA commercial bond rates decreased .03% to 6.07%. This compares with an identical 03% decrease in the yields of 10 year treasuries to 3.51%. Over the last 6 months both series have seen higher interest rates, but government bonds have generally been weaker. There remains no sign of corporate distress here.
M1 was down 1.0% w/w, up 1.3% M/M, and up 11.9% YoY, so Real M1 is up 9.2%. M2 was unchanged w/w, up 0.2% M/M and up 4.7% YoY, so Real M2 is up 2.0%. Although Real M1 is still strongly in the "green zone" where it has been since before the end of the "great recession," Real M2 continues to fade further back into the "yellow zone" below 2.5%.
Finally, this week I want to pay tribute to market pundit Joe Battipaglia, who passed away suddenly last week. I first heard him in about 1994. Bears like Jim Rogers were persuasively making their case, the market would swoon 10%, Elaine Gharzarelli would say her market indicators now foretold a crash, and along would come raging bull Joe Battipaglia, making the case that tech advances were a tsunami of rising efficiency. Of course, the market would turn within minutes of Gharzarelli's pronouncement of Doom. Battipaglia wasn't just right. He was right for the right reasons. But he wasn't a permabull. He was much more sober and cautious at all of the right times this past decade, but bullish again in the last couple of years.
In short, amidst all of the pundits talking their book to the rubes, Joe Battipaglia stood out as someone who continued to be mainly right, and mainly for the right reasons. Allow me to pay him the highest compliment for a pundit: when Battipaglia talked, I stopped and listened. He will be missed.
Remember that all things must pass, including our own brief tenures. Carpe Diem! Enjoy this weekend.
Friday, April 22, 2011
Leading Indicators Up .4
From the Conference Board:
Says Ataman Ozyildirim, economist at The Conference Board: “The U.S. LEI continued to increase in March, pointing to strengthening business conditions in the near term. The March increase was led by the interest rate spread and housing permits components, while consumer expectations dropped. The U.S. CEI, a monthly measure of current economic conditions, also continued to rise, led by gains in industrial production and employment.”Says Ken Goldstein, economist at The Conference Board: “The U.S. LEI continues to point to sustained economic growth through year end. Global disruptions, including unrest in the Middle East, rising oil prices and the Japan earthquake, may have some repercussions. However, it remains to be seen what the impact of these shocks will be on the United States and the broader global economy.”
Take a closer look at the underlying data:

Click for a large image
While the overall index is up, there are a few points about the data that is concerning.
1.) The average workweek is barely up since last September. Consider that data in light of this chart of the Index of Aggregate Weekly Hours of Production and Non-Supervisory Employees

The total dropped hard during the recession and is still barely recovering, indicating there is still tremendous slack in the labor market that employers can access before adding a bevy of new employees.
2.) Manufacturers new orders for non-defense goods tumbled last month. Consider that in light of the larger durable goods picture.
3.) M2 dropped slightly and the interest rate spread came in slightly.
4.) Consumer expectations took a tumble and accounted for a large percentage of the negative side of the LEI equation. This is probably the result of fuel prices. Here is more information on the situation:
Amid rising gas prices, stubborn unemployment and a cacophonous debate in Washington over the federal government’s ability to meet its future obligations, the poll presents stark evidence that the slow, if unsteady, gains in public confidence earlier this year that a recovery was under way are now all but gone.Capturing what appears to be an abrupt change in attitude, the survey shows that the number of Americans who think the economy is getting worse has jumped 13 percentage points in just one month. Though there have been encouraging signs of renewed growth since last fall, many economists are having second thoughts, warning that the pace of expansion might not be fast enough to create significant numbers of new jobs.
Friday Linkfest
Corey looks at the Treasury and silver market.
Invictus takes Heritage to task (again) -- and Menzie Chinn follows up as well.
College loans weigh on graduates.
Housing lock is not preventing employment migration.
What -- US Worry?
Why Multi-nationals expand abroad.
Is export led growth still a viable strategy?
Invictus takes Heritage to task (again) -- and Menzie Chinn follows up as well.
College loans weigh on graduates.
Housing lock is not preventing employment migration.
What -- US Worry?
Why Multi-nationals expand abroad.
Is export led growth still a viable strategy?
Thursday, April 21, 2011
Friday Dollar Analysis
Here is what I wrote about the dollar last week:

The 4-year, weekly chart of the dollar shows the market has clearly dropped below the 22 price level, which had provided technical support for the last four years. Also note the weekly EMA positions -- the shorter EMAs are below the longer EMAs, prices are below all the EMAs and all are moving lower. This is the most bearish orientation possible.

The daily chart is also extremely bearish. All the EMAs are moving lower, the shorter are below the longer and prices are below all the EMAs. While we should expect prices to rebound in a standard move, expect to see the EMAs provide upside resistance.

The technical position is still very bearish as well. The A/D and CMF show money leaving the market and the MACD shows no momentum whatsoever.
Given the above charts, and the fact nothing has fundamentally changed in the big picture for the dollar, my assessment of the dollar market for the coming week is the exact same as it was for last week: more moves lower with rebounds into the EMAs providing upside resistance.
Adding all of these factors together, we get a chart that is fundamentally very bearish in multiple time frames. The multi-year chart shows prices breaking lower from a long consolidation pattern, the 6-month chart shows prices in a lower low, lower high structure and the technical indicators are all bearish. This is backed by the fundamental background.
1.) Other countries are raising rates, making their economies more attractive as a place to park short-term investments.
2.) It appears that US growth is slowing. This is adding to the bearish analysis.
3.) The long-term budget situation is still at best murky.
4.) There is concern about inflation, and whether or not the Fed is behind the inflation 8-ball.
However, over the next week or so, don't be surprised to see the dollar rise. Why?
On the chart notice that prices have gapped lower on slightly heavy volume. A rebound into the EMAs is possible at this level.
The 4-year, weekly chart of the dollar shows the market has clearly dropped below the 22 price level, which had provided technical support for the last four years. Also note the weekly EMA positions -- the shorter EMAs are below the longer EMAs, prices are below all the EMAs and all are moving lower. This is the most bearish orientation possible.

The daily chart is also extremely bearish. All the EMAs are moving lower, the shorter are below the longer and prices are below all the EMAs. While we should expect prices to rebound in a standard move, expect to see the EMAs provide upside resistance.

The technical position is still very bearish as well. The A/D and CMF show money leaving the market and the MACD shows no momentum whatsoever.
Given the above charts, and the fact nothing has fundamentally changed in the big picture for the dollar, my assessment of the dollar market for the coming week is the exact same as it was for last week: more moves lower with rebounds into the EMAs providing upside resistance.
Money Velocity Is Way Too Low
The velocity of money is defined thusly:
This statistic measures how fast money is moving through the economy. For example, suppose I get paid on Friday. If I spend most of my paycheck that weekend, the money velocity created by my spending will be high. However, suppose I put all my money in a bank account and don't spend it until a year later. That would lead to a lower money velocity and lower growth.
In light of that, consider the following charts of money velocity.

M2's velocity is slightly above multi-decade lows

M1's velocity is still high, but it dropped during the recession and continues to move lower.

MZM velocity is just above multi-decade lows.
In short, all the velocity indicators are telling us that the turnover of money is weakening, indicating slower transactional speed and hence weaker economic activity.
The speed with which MONEY whizzes around the economy, or, put another way, the number of times it changes hands. Technically, it is measured as GNP divided by the MONEY SUPPLY (pick your own definition). It is an important ingredient of the QUANTITY THEORY OF MONEY.
This statistic measures how fast money is moving through the economy. For example, suppose I get paid on Friday. If I spend most of my paycheck that weekend, the money velocity created by my spending will be high. However, suppose I put all my money in a bank account and don't spend it until a year later. That would lead to a lower money velocity and lower growth.
In light of that, consider the following charts of money velocity.

M2's velocity is slightly above multi-decade lows

M1's velocity is still high, but it dropped during the recession and continues to move lower.

MZM velocity is just above multi-decade lows.
In short, all the velocity indicators are telling us that the turnover of money is weakening, indicating slower transactional speed and hence weaker economic activity.
Obama approval: in fact it's a gas, too
- by New Deal democrat
Yesterday I discussed how Oil prices have shot up enough to be considered a "shock" to the economy. One person in particular who should be very concerned by that is President Barack Obama. Why? Because his approval ratings, like those of George W. Bush before him, have closely tracked with the price of Oil.
Prof. Pollkatz notoriously kept a record during the eight years of Bush's presidency of a graph he called "Bush Approval: In Fact It's a Gas":
If you look carefully, you can see how Bush's approval rating lagged changes in gas prices by about 2 to 3 months consistently throughout his presidency.
Now, let's look at a graph published yesterday of the ABC/Washington Post poll showing Barack Obama's approval ratings tied for their lowest to date, and conversely disapproval the highest:

Now here is a graph of gasoline prices from January 20, 2009 to date:
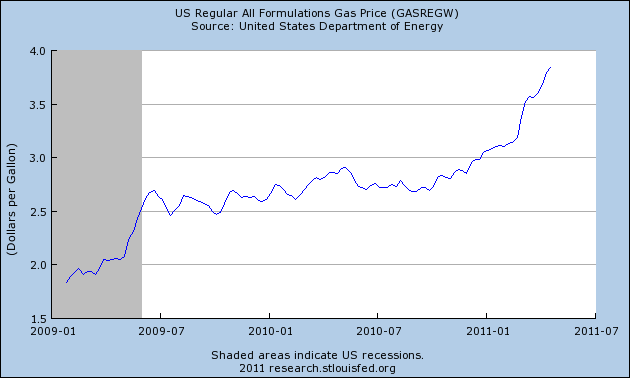
Notice that both Obama disapproval and gas prices have the same series of peaks and valleys, and keep in mind that Obama's approval ratings, like Bush's, appear to lag a couple of months behind gas prices - suggesting that the last surge in gasoline prices hasn't yet found its way into Obama's approval ratings.
There's no rocket science here. Presidential approval ratings tend to track the economy, and gas prices, especially as they reach the thresholds we discussed yesterday, take a few months to feed through into the economy as a whole.
Barack Obama should be thanking his lucky stars that it is 2011 and not 2012. And he'd better hope that Oil's choke hold on the economy loosens by then.
Yesterday I discussed how Oil prices have shot up enough to be considered a "shock" to the economy. One person in particular who should be very concerned by that is President Barack Obama. Why? Because his approval ratings, like those of George W. Bush before him, have closely tracked with the price of Oil.
Prof. Pollkatz notoriously kept a record during the eight years of Bush's presidency of a graph he called "Bush Approval: In Fact It's a Gas":
If you look carefully, you can see how Bush's approval rating lagged changes in gas prices by about 2 to 3 months consistently throughout his presidency.
Now, let's look at a graph published yesterday of the ABC/Washington Post poll showing Barack Obama's approval ratings tied for their lowest to date, and conversely disapproval the highest:
Now here is a graph of gasoline prices from January 20, 2009 to date:
Notice that both Obama disapproval and gas prices have the same series of peaks and valleys, and keep in mind that Obama's approval ratings, like Bush's, appear to lag a couple of months behind gas prices - suggesting that the last surge in gasoline prices hasn't yet found its way into Obama's approval ratings.
There's no rocket science here. Presidential approval ratings tend to track the economy, and gas prices, especially as they reach the thresholds we discussed yesterday, take a few months to feed through into the economy as a whole.
Barack Obama should be thanking his lucky stars that it is 2011 and not 2012. And he'd better hope that Oil's choke hold on the economy loosens by then.
Beige Book, Part IV: Banking/Finance
From the Federal Reserve:
Some thoughts, in no order of importance
-- Mortgage lending is at best very slow, although several districts reported an increase in home equity lines of credit
-- No district reported major drops in lending standards. In fact, I would argue that an overall increase in lending standards relative to the previous 10 years is a big factor in the slower loan growth.
-- The general tenor of lending activity was at best low increases, while several districts reported decreases
Let's look at total loans across the US, courtesy of the St. Louis Fed:

Total real estate loans are also decreasing

(remember, the large spike is due to a recalibration of the statistic, not to an actual increase in loans). Total consumer loans are decreasing, and have been throughout the expansion.

Total commercial and industrial loans have bottomed, but haven't really increased; they're still bouncing at a low level relative to previous activity.
The above chart indicates that credit is barely expanding, and that's only because of C and I loans. Consumer and real estate loans are still dropping. Part of this is due to tougher new lending standards, but some is also due to consumers cutting back on loans and businesses shying away from new indebtedness because of concerns about the future.
NY: Bankers report decreased demand for consumer loans and residential mortgages, increased demand for commercial mortgages and no change in demand for commercial and industrial loans. The decrease was most prevalent for residential mortgages. Bankers indicate steady demand for refinancing. Respondents report no change in credit standards for consumer loans and a tightening of credit standards for the other loan categories. No banker reported an easing of credit standards in any category. Bankers report a decrease in spreads of loan rates over costs of funds for residential mortgages but no change in spreads in the other loan categories. Respondents also note a decrease in the average deposit rate. Bankers report an uptick in delinquency rates for commercial and industrial loans but no change in delinquency rates for the other loan categories.
Philly: Total outstanding loan volume at most of the Third District banks contacted for this report has shown little change in recent weeks. Some banks in the region reported recent increases in lending extended on home equity credit lines, but other forms of consumer credit have been level or moved down. Some banks reported increases in commercial and industrial loans and some types of commercial real estate loans. One banker said, "We're making more small business loans, and commercial real estate lending is picking up except for retail properties." The outlook among Third District bankers interviewed for this report is that total loan volume will expand slowly this year, as overall economic activity advances, with gains mostly in commercial and industrial and consumer lending, but lending for residential or commercial construction is not expected to increase.
Cleveland: Bankers reported that demand for business loans grew at a modest pace since our last survey. Although demand was characterized as broad-based, some bankers commented that applications were strongest from health-care providers and energy companies. On the consumer side, a majority of our contacts indicated that credit demand has picked up slightly, primarily for vehicle purchases (direct and indirect) and home equity lines of credit. Interest rates for business and consumer credit were stable, but competitive. Demand in the residential mortgage market is mainly for refinancings, although applications have slowed due to rising interest rates. Core deposits continue to grow, but at a lower rate, with almost all growth occurring in nonmaturing products. Credit standards were unchanged. The credit quality of businesses and consumer applicants was characterized as stable or improving, while delinquency rates were steady or trending down across most portfolios. Staffing levels have shown little change during the past few weeks, and only selective hiring is expected during 2011.
Richmond: Banking activity picked up across the District. Most bank officials whom we contacted noted a marked increase in interest from business clients, often to restart projects that had been delayed over the past two years. Several bankers also reported that their lending had grown from weak levels at the end of last year. A Virginia banker stated that consumer demand, while still quite soft, had improved, while a Richmond banker in a relatively affluent neighborhood cited a spike in equity line usage (often to be used for pre-sale home renovations). Most commercial bankers reported that small business lending had strengthened somewhat, with much of the funds going to equipment upgrades and plant expansions. A bank official in West Virginia reported that auto dealer inventory financing increased, but overall the bank's loan pipeline was slack and he was unenthusiastic about loan demand in general. Reports on mortgage lending activity were mixed.
Atlanta: District bankers reported that demand for most types of loans remained low and lending standards remained tight in February and March. Many cited that credit was available but finding qualified borrowers continued to be difficult. Some community bankers noted encouraging reports of loan demand surfacing in the last few months, especially among small business owners.
Chicago: Credit conditions continued to improve in February and March. Banking contacts indicated that the business loan pipeline was still not robust, but that there were some areas of growth in manufacturing, food processing, and healthcare. Competition continued to be fierce for high-quality commercial and industrial loans (both large and small) leading to more aggressive terms and pricing. In addition, bank and non-bank investment in commercial real estate assets was also noted to be increasing. Consumer lending was little changed from the previous reporting period. Mortgage applications decreased and those made were primarily for purchase, as refinancing slowed with a rise in mortgage rates. Several contacts raised concerns about the impact that uncertainty surrounding the future of Fannie Mae and Freddie Mac and the regulatory environment were having on mortgage credit availability.
St. Louis: Total loans outstanding at a sample of small and mid-sized District banks decreased 3.2 percent in the three-month period from mid-December to mid-March. Real estate lending, which accounts for 74.9 percent of total loans, decreased 1.3 percent. Commercial and industrial loans, accounting for 15.4 percent of total loans, decreased 8.7 percent. Loans to individuals, accounting for 5.0 percent of loans, decreased 2.6 percent. All other loans decreased 16.7 percent and accounted for 4.7 percent of total loans. Over this period, total deposits decreased 1.7 percent.
KC: In the recent survey period, bankers reported weaker loan demand, but also rising deposits and improvements in loan quality. Overall loan demand decreased as demand for commercial and industrial, residential real estate, consumer installment, and commercial real estate loans declined. For the fifth straight survey, credit standards remained unchanged in all major loan categories. Deposits increased further in the recent survey period. Bankers also reported improvements in loan quality compared to a year ago, and they expected further improvements over the next six months.
Dallas: Financial firms reported a slight improvement in overall loan demand. National banks reported some pickup in commercial and industrial (C&I) loan demand with increased corporate activity, while they continue to see weakness in commercial real estate (CRE). Regional banks noted that loan demand remains pretty flat, although there was a small increase in optimism regarding homebuilding and some CRE lending at the community-bank level. Most contacts said loan pricing remains aggressive amidst a highly competitive lending landscape. Outlooks are gradually improving in light of better outstanding loan quality and continued slow progress in lending conditions.
Frisco: District banking contacts reported that loan demand was up compared with the prior reporting period. Demand for commercial and industrial loans rose perceptibly, as businesses in a variety of sectors reportedly showed increased interest in expansionary capital spending. Demand for consumer credit also grew slightly. The reports indicated that competition among lenders to extend credit to well-qualified small and medium-sized businesses has intensified, placing downward pressure on rates and fees. Overall, however, lending standards remained somewhat restrictive for most types of consumer and business loans. Venture capital financing activity and investor interest continued to grow, particularly for companies focused on Internet and wireless applications and digital media.
Some thoughts, in no order of importance
-- Mortgage lending is at best very slow, although several districts reported an increase in home equity lines of credit
-- No district reported major drops in lending standards. In fact, I would argue that an overall increase in lending standards relative to the previous 10 years is a big factor in the slower loan growth.
-- The general tenor of lending activity was at best low increases, while several districts reported decreases
Let's look at total loans across the US, courtesy of the St. Louis Fed:

Total real estate loans are also decreasing

(remember, the large spike is due to a recalibration of the statistic, not to an actual increase in loans). Total consumer loans are decreasing, and have been throughout the expansion.

Total commercial and industrial loans have bottomed, but haven't really increased; they're still bouncing at a low level relative to previous activity.
The above chart indicates that credit is barely expanding, and that's only because of C and I loans. Consumer and real estate loans are still dropping. Part of this is due to tougher new lending standards, but some is also due to consumers cutting back on loans and businesses shying away from new indebtedness because of concerns about the future.
Thursday Oil Market Analysis
Last week, I wrote the following about the oil market:
My thought process was essentially prices were in the middle of a correction, largely caused by the phrase, "the only cure for higher oil prices is high oil prices;" high oil prices strangle economic growth, lowering demand for oil, hence lowering oil prices. However, there is clear support in the market. Consider the 6 month chart:

There are two important trend lines on this chart. The first starts at a low in late November and the second starts at a low in late February. While the shorter one is a bit steeper, it is not parabolic, so it could conceivably hold for some time. The 50 day EMA is moving higher, indicating a rising, longer-term trend, but the shorter EMAs are less steep, indicating a pause. However, the EMAs are still bullishly aligned.
The declining MACD is concerning for the bulls, as the indicator has printed lower tops for higher price action, which is usually a sign of a stalling market.
In addition, consider this shorter chart:

Over the last few weeks, with the exception of today, the price action has been weak. There were two strong down bars, three weaker moves higher, another strong downward bar and then a weak up bar. Today's action is the only strong bar over the last 8 trading sessions.
The overall feeling I can't shake is that with gas at $3.84/gallon on average, traders are incredibly sensitive to the effect of higher oil prices on the expansion. This is probably what led Goldman to issue its sell recommendation on commodities last week. In short, I keep thinking we already have a top built into the market caused by economic fundamentals. On that order, consider this chart from the St. Louis FRED:

The chart compares Brent Crude and regular gas prices on a scale of 100. The last time gas prices were at or near this level was the beginning of the last recession. While we probably still have some upside room for gas prices before we hit recession inducting levels, we're a lot closer than we want to be at this point. In short, I have to wonder how much upside room oil prices have before we hit a slowdown, and hence have traders selling long positions.
Going forward, I would expect prices to continue moving lower. However, I would view this as a temporary development. The lower MACD print, strong downward candles and increased volume on the latest sell-off indicate profit taking is in order.
While there are signs of a slowdown, no one (except those who can't help themselves) is calling for a recession. Instead, analysts are noting that high oil prices will lead to lower growth.
In addition we are moving into the summer driving season, which historically leads to higher demand and therefore higher prices.
My thought process was essentially prices were in the middle of a correction, largely caused by the phrase, "the only cure for higher oil prices is high oil prices;" high oil prices strangle economic growth, lowering demand for oil, hence lowering oil prices. However, there is clear support in the market. Consider the 6 month chart:

There are two important trend lines on this chart. The first starts at a low in late November and the second starts at a low in late February. While the shorter one is a bit steeper, it is not parabolic, so it could conceivably hold for some time. The 50 day EMA is moving higher, indicating a rising, longer-term trend, but the shorter EMAs are less steep, indicating a pause. However, the EMAs are still bullishly aligned.
The declining MACD is concerning for the bulls, as the indicator has printed lower tops for higher price action, which is usually a sign of a stalling market.
In addition, consider this shorter chart:

Over the last few weeks, with the exception of today, the price action has been weak. There were two strong down bars, three weaker moves higher, another strong downward bar and then a weak up bar. Today's action is the only strong bar over the last 8 trading sessions.
The overall feeling I can't shake is that with gas at $3.84/gallon on average, traders are incredibly sensitive to the effect of higher oil prices on the expansion. This is probably what led Goldman to issue its sell recommendation on commodities last week. In short, I keep thinking we already have a top built into the market caused by economic fundamentals. On that order, consider this chart from the St. Louis FRED:

The chart compares Brent Crude and regular gas prices on a scale of 100. The last time gas prices were at or near this level was the beginning of the last recession. While we probably still have some upside room for gas prices before we hit recession inducting levels, we're a lot closer than we want to be at this point. In short, I have to wonder how much upside room oil prices have before we hit a slowdown, and hence have traders selling long positions.
Wednesday, April 20, 2011
Beige Book Part III; Prices
From the Federal Reserve:
Input prices rose in most Districts, particularly for cotton and other agricultural commodities, petroleum-based products, and industrial metals. In addition, shippers added fuel surcharges in several Districts. Boston, Cleveland and Atlanta cited increasing cost pressures, and some manufacturers in Boston were raising their selling price to pass costs along to customers. The ability to pass through increases, however, varied in both the Chicago and Atlanta Districts, with manufacturers generally being more successful than retail or construction firms. Contacts in the San Francisco District reported a limited ability to pass through higher input prices on anything other than food and gasoline. Kansas Cited stated that more manufacturers and retailers expected to raise prices in coming months.Wage pressures were reported to be mostly contained, especially in the Philadelphia, Cleveland, Minneapolis, Dallas, and San Francisco Districts. Kansas City noted wages generally held steady, even with expanded hiring, and wage pressures were expected to be contained except for highly competitive or specialized positions. Wage pressures were described as modest in the Chicago District. However, Richmond reported slightly faster wage increases. Boston reported that nearly all of the manufacturing firms that they contacted planned to implement merit increases, and one contact planned a greater merit pool next year to compensate for previous low raises. Philadelphia noted some concern about rising nonwage employment costs, but wages for business firms in the District were mostly steady.
Philly: Reports from manufacturers since the previous Beige Book continue to indicate rising factor prices, especially for energy inputs. Far fewer manufacturers report raising output prices, while a few indicate resistance to hikes from their customers, if not expectations of discounts. Retailers generally indicated that selling prices have been steady, although some reported that they have raised apparel prices in response to higher wholesale costs. Auto dealers reported continuing high prices for used cars and recent increases in prices for new cars. Although the predominant view among Third District firms is that overall inflation will move higher, slightly fewer firms expressed that view compared to reports from the last Beige Book. Nevertheless, several firms in the region said they have implemented hedges or signed forward contracts for motor fuels.
Business firms in the region reported mostly steady wages since the last Beige Book, although some continued to express concern about rising nonwage employment costs. Employment agencies reported growth in demand for workers, although they indicated that firms were continuing to delay additions to permanent or temporary staff until the need for more workers becomes pressing.
Atlanta: Firms' expectations for unit cost increases over the next year continued to rise, with material costs and employee salaries and benefits cited as sources of potential cost pressures. Reports of price pass-through were mixed across the District and varied based on industry and the presence of competitive pressures. For example, many retailers noted that strong competition was limiting their ability to raise prices. Homebuilders said that they have been unable to pass through material cost increases because of persistent downward pressure on home prices. However, many manufacturers were more successful in increasing prices to their customers.
Chicago: Cost pressures rose in February and March. Wage pressures remained moderate, but raw materials prices increased. The most notable increases were for steel and other industrial metals, but the prices of plastics, paints, resins and cotton also rose. Fuel and transportation surcharges were also noted to be rising. Pass-through to downstream prices was moderate, however. Retailers indicated that they were trying to limit raising prices, though pass-through was noted to be increasing, particularly for food and energy-related items. In contrast, several manufacturing contacts reported an increase in pricing power, with less pushback from customers in accepting higher prices. Commercial builders have been able to pass along minimal price increases to offset some of their higher raw material costs, although residential builders have not been able to do so.
Minneapolis: Wage increases remained subdued. Manufacturing wages in District states were up slightly in February compared with a year earlier.
Retail price increases were modest, but price pressures for inputs continued. According to the Minneapolis Fed's ad hoc survey, 25 percent of respondents increased prices for their final goods and services during the past six weeks, while 53 percent noted increased input prices. Minnesota gasoline prices at the end of March were about the same as in mid-February, but were 75 cents per gallon higher than a year ago. While a number of metals prices remained well above year-ago levels, some prices decreased slightly since the last report. In Minnesota, a chamber of commerce representative noted that a surprising number of businesses took advantage of lower commodity prices last year to negotiate deals that provided at least short-run protection.
KC: Wages generally held steady even with expanded hiring, and more firms planned to increase selling prices, especially in industries where input prices have surged. Of the companies that added staff, most were not offering higher salaries to attract applicants. With the exception of highly competitive or specialized positions, wage pressures were expected to remain contained. Many District manufacturers reported another jump in raw materials prices, and some companies had already raised finished goods prices with more firms planning to do so in the coming months. Several construction suppliers and transportation companies reported fuel and delivery surcharges were common, and higher input costs were often being passed through to customer prices. Some restaurants increased menu prices in reaction to higher food costs, and some hotels raised room rates. District retailers also expected an uptick in selling prices with stronger consumer demand.
Dallas: Price pressures continued to build since the last report. Many responding firms said high fuel prices were causing their input costs to rise, and contacts in the lumber and transportation services industries increased selling prices in response. Some manufacturers noted steel prices had risen, and most construction respondents said metal and petroleum based products, such as rebar, copper and asphalt had increased in price. In the service sector, airline fares were up significantly due to increases in the price of jet fuel. Legal contacts noted slight increases in billing rates, and retailers continued to report upticks in food prices.
The price of crude oil rose from $85 per barrel in mid-February to over $100 per barrel in late March. Natural gas prices receded early in the reporting period as cold weather subsided, but strengthened again to over $4 per Mcf at the end of March, due to geopolitical uncertainties and rising crude oil prices. Prices for most petrochemical products increased since the last report, according to respondents.
Frisco: Price inflation for final goods and services was modest during the reporting period. Although prices remained elevated for an assortment of raw materials and commodities and rose further for some, such as oil, the pass-through to final prices was quite limited, with the noteworthy exceptions of food and gasoline. For most other retail goods and services, prices continued to be held down by subdued demand and vigorous competition.
Contacts in most sectors reported that upward wage pressures remained weak. High unemployment and limited hiring kept compensation gains at low levels in most regions and sectors, although significant upward wage pressures were noted for workers with advanced skills in technology fields. Looking ahead to the next six months, the reports indicated that wage gains are likely to pick up somewhat as more businesses eliminate wage freezes established during the downturn.
-- Manufacturing is bearing the brunt of the price increases. As such, it's important to remember the difference and relationship between crude, intermediate and final prices.

When I previously presented the above chart, I explained it thusly:
The above chart shows crude, intermediate and end producer prices for the last 30 years. Notice that we can group these prices into two groups: crude prices (which are far more volatile) and intermediate and finished PPI (which are far less volatile). Also note the intermediate stages of production appear to absorb the price increases of crude goods very well and by the time we get to finished goods the impact of crude price volatility is noticeably diminished.
Manufacturers are able to absorb a fair amount of the price increases occurring in production right now -- although I would also mention there is probably a time limit to that situation; at some point, we will start to see increased prices as a result of rising commodity prices.
-- Several districts reported the addition of fuel surcharges to transportation costs. This is to be expected.
-- Dallas mentioned the increase in fuel prices as a reason for rising transportation costs.
-- Several districts noted that businesses used the period of low commodity prices to negotiate favorable contracts.
-- Not all industries are able to pass on higher prices. The residential housing market's prices are still dropping, preventing the ability to pass through raw material price increases. Commercial real estate is in somewhat of the same boat.
-- Wage pressures are non-existent
The Oil shock of 2011 has begun
- by New Deal democrat
With Oil near $110 a barrel and gasoline prices over $3.75 a gallon, it seems worthwhile to revisit a post I wrote almost exactly one year ago, examining Oil prices and the recovery.
There are two mavens of Oil prices that I turned to: Econbrowser's Prof. James Hamilton and Douglas-Westwood Oil analyst Steve Kopits. Both used similar metrics, but their conclusions differed considerably (click on the link above to read the entire discussion).
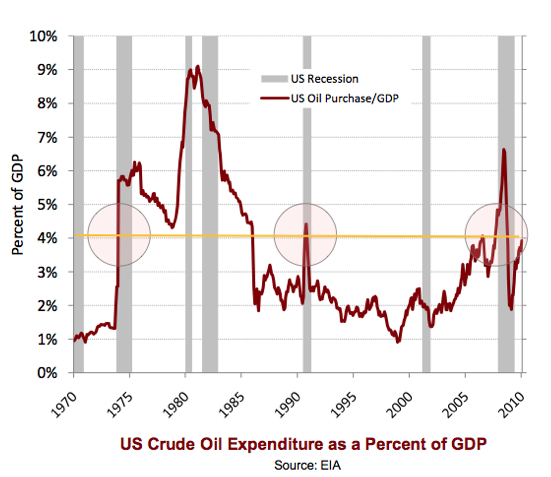
Kopits' point of view was straightforward: "In every case, when oil consumption in the US reached 4% percent of GDP, the U.S. went into recession." In 2010, Kopits pegged that price as $84 a barrel. Additionally, Kopits noted that all of those cases also coincided with a 50% increase in the price of Oil YoY, creating a "shock."
With Oil near $110 a barrel and gasoline prices over $3.75 a gallon, it seems worthwhile to revisit a post I wrote almost exactly one year ago, examining Oil prices and the recovery.
There are two mavens of Oil prices that I turned to: Econbrowser's Prof. James Hamilton and Douglas-Westwood Oil analyst Steve Kopits. Both used similar metrics, but their conclusions differed considerably (click on the link above to read the entire discussion).
Kopits' point of view was straightforward: "In every case, when oil consumption in the US reached 4% percent of GDP, the U.S. went into recession." In 2010, Kopits pegged that price as $84 a barrel. Additionally, Kopits noted that all of those cases also coincided with a 50% increase in the price of Oil YoY, creating a "shock."
Hamilton espoused a similar point of view (price threshold plus shock) but applied different metrics, in particular that the price of Oil had to cross into uncharted higher territory:
One year later, we can see some further clarity. In both 2006 and 2010, Oil briefly crossed the threshold of 4% of GDP. In 2006 that coincided with one quarter of GDP growth of only 0.5%. In 2010 that quarter saw only 1.7% growth in GDP.
Last year, Oil very briefly touched $90 a barrel. For the last month, this year Oil has been over $100. In February of this year, Prof. Hamilton was still sanguine, observing Good news from auto sales -- for now. In particular he noted that "SUV sales are still far enough below even February 2008 values that it wouldn't represent the same size hit to GDP as we experienced in the spring of 2008 even if light truck sales were to decline from here back to the levels of June 2008."
Kopits, however, has been warning of another Oil shock in 2012, if not sooner. As of three weeks ago, he said:
The metrics:
First, here is Professor Hamilton's latest graph of Oil as a share of consumer purchasing, from February. Since then there has been a further substantial spike :

Next, here is Steve Kopits' graph of Oil price as a share of GDP, dating from 2010:
Here is an update of Kopits' metric, including GDP through 4Q 2010 and gas prices through last month (normed at 1.0 in 1990, when consumption barely exceeded 4% of GDP):
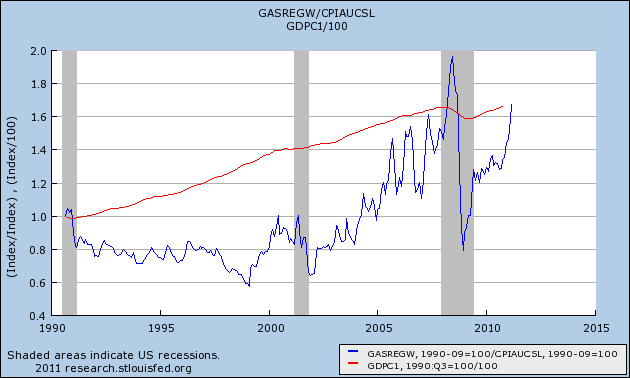
At this point it is clear that Oil consumption is more than 4% of GDP and also more than 6% of purchasing power.
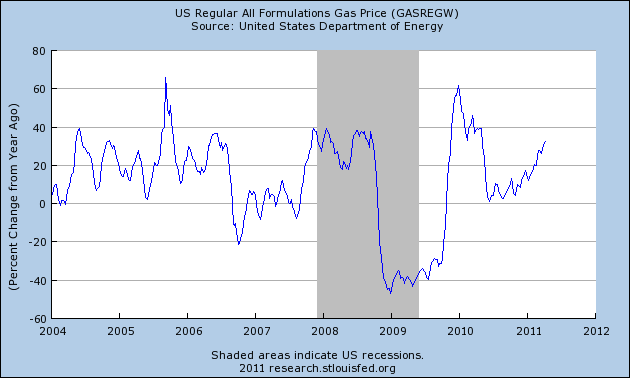
But what about the "shock?" As this graph shows, a 40% sustained increase YoY was sufficient to coincide with a recession at the end of 2007. If Oil continues to trade at $110 a barrel into May, we will pass the 40% threshold again:
In short, we appear to be on the verge of satisfying the criteria from both models for an Oil shock induced recession. Only the fact that Oil has not made a new all time high appears to be missing.
The fallout:
In February, Prof. Hamilton was optimistic. There had not been any "abrupt drops in consumer sentiment, postponement of purchases of consumer durables, and important changes in the kinds of vehicles consumers buy." The data since then is more ominous. [Note: in all the graphs that follow, gas prices are in blue]:
Consumer sentiment, which had been see-sawing in late 2010
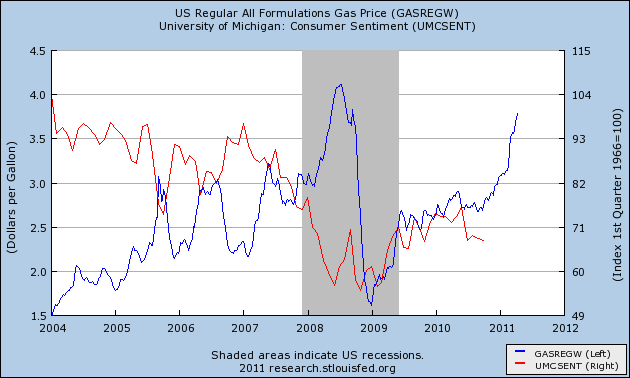
has once again cratered in the last several months:
New car sales declined slightly in March:
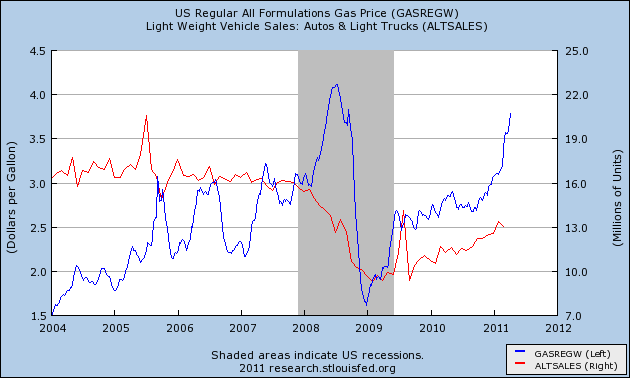
In response, Professor Hamilton observed that
Truecar CEO Scott Painter said in the video that there had been a significant shift towards gas efficient cars and hybrids just in the last 30 days - similar to that last seen in April 2008.
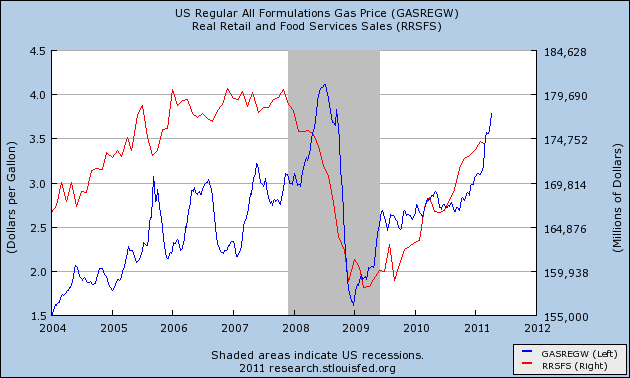
There are other signs of weakness as well. As I noted last Friday, real retail sales turned negative in March for the first time since last summer's slowdown:
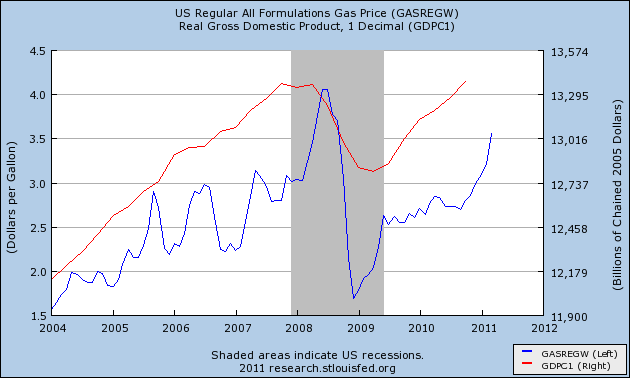
GDP, which had been expected to grow smartly, is now projected to have grown under 2% in the first quarter, similar to 3Q 2006 and 2Q 2010 - and that is before the most recent continuation of the spike:
Rail traffic is still growing, but its relative YoY progess has stalled. In the graph below, the upturn in the last several weeks is exclusively due to intermodal containers used in imports and exports:
Temporary hiring, as measured by the American Staffing Association Index on a weekly basis, has also failed to continue its relative YoY improvement:
The Department of Energy's report of weekly gasoline consumption has also been negative YoY for the last 5 weeks.
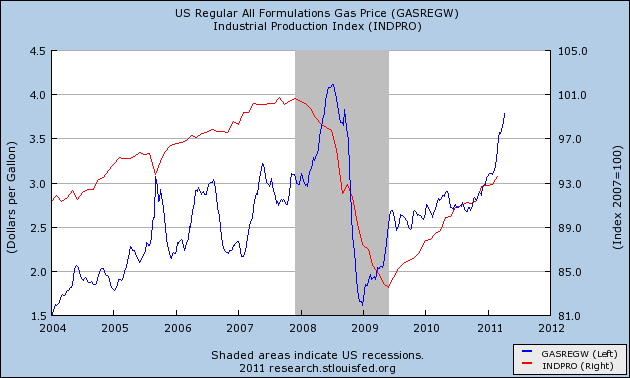
The story with Industrial production is more equivocal. It was up .8% in March, but for the last 3 months as a whole its increase has been tepid, but not in any definite way breaking trend from its recession bottom:
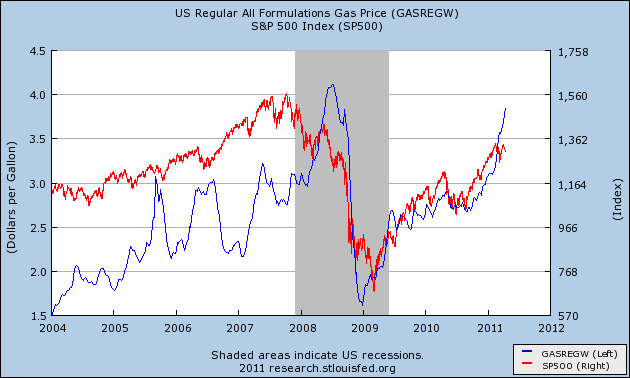
Finally, the S&P 500, which normally rises with the price of Oil in expansions, has also failed to make a new high in the last two months, mirroring its stalls of 2006, 2007, and May 2010:
Many of the statistics cited above have only turned down for one month, and one data point obviously does not make a trend. The point is, the data is behaving exactly like we would expect it to behave if we had reached a turning point in an Oil shock.
So, am I calling for renewed recession? Not at this time. While I expect the Leading Economic Indicators report on Friday to be "soft," with the strong housing permits data on Tuesday it will certainly be positive. Typically recessions do not begin until at least 8 of the 10 LEI are negative compared with 6 months previous, or the LEI are down 3 months in a row. Also Real M1 is growing at about 10%, and there has never been a recession going all the way back to the Great Depression with Real M1 positive. Further, Prof. Hamilton's point that many consumers have already made the adjustment to $3.75 gas - via for example their small car purchases several years ago - has a lot of merit.
But if Oil prices remain elevated for several more months, the LEI turning negative becomes more of a possibility. At very least, the Oil shock of 2011 has almost certainly begun, and it is likely already causing a substantial slowdown.
[T]here is a threshold effect before the next oil price shock would begin to do its damage. According to that relation, oil has to get back above $130 before it would matter again for GDP growth.... Another magnitude ... important to watch is the share of the budget of an average U.S. consumer that is devoted to energy purchases. This had fallen considerably in the 1990s, making it easier for many consumers to largely ignore modest energy price fluctuations. When this share rises above 6%, it seems to become a more significant factor.In Hamilton's analysis, Oil price increases first show up as increased spending, or decreased savings. But if the price continues to rise
[I]t is not just the level of consumer spending but also a sudden change in its composition that sometimes contributes to an economic recession. When oil price increases are sufficiently sudden and dramatic, we see abrupt drops in consumer sentiment, postponement of purchases of consumer durables, and important changes in the kinds of vehicles consumers buy.Spencer England of the Angry Bear blog also pointed to an interesting corollary: "If you do consumer spending on energy as a share of consumer spending plus spending on autos you get a very stable ratio. This suggest one of the biggest ways consumers adjust to higher oil prices is to delay buying a new auto."
One year later, we can see some further clarity. In both 2006 and 2010, Oil briefly crossed the threshold of 4% of GDP. In 2006 that coincided with one quarter of GDP growth of only 0.5%. In 2010 that quarter saw only 1.7% growth in GDP.
Last year, Oil very briefly touched $90 a barrel. For the last month, this year Oil has been over $100. In February of this year, Prof. Hamilton was still sanguine, observing Good news from auto sales -- for now. In particular he noted that "SUV sales are still far enough below even February 2008 values that it wouldn't represent the same size hit to GDP as we experienced in the spring of 2008 even if light truck sales were to decline from here back to the levels of June 2008."
Kopits, however, has been warning of another Oil shock in 2012, if not sooner. As of three weeks ago, he said:
Right now, the 4% limit is about $88 / barrel crude. Brent's at $115. On paper, this should be enough to put us into recession. On the other hand, the recovery is providing momentum the other way. So, as [Prof. Hamilton] points out, the oil price is a drag, rather than a killer right now.So, is a slowdown or even a recession baked in the cake? With the spike in Oil prices from $90 a barrel to $110 a barrel in the last two months, is Hamilton's optimism still warranted? Let's look at the data.
The metrics:
First, here is Professor Hamilton's latest graph of Oil as a share of consumer purchasing, from February. Since then there has been a further substantial spike :
Next, here is Steve Kopits' graph of Oil price as a share of GDP, dating from 2010:
Here is an update of Kopits' metric, including GDP through 4Q 2010 and gas prices through last month (normed at 1.0 in 1990, when consumption barely exceeded 4% of GDP):
At this point it is clear that Oil consumption is more than 4% of GDP and also more than 6% of purchasing power.
But what about the "shock?" As this graph shows, a 40% sustained increase YoY was sufficient to coincide with a recession at the end of 2007. If Oil continues to trade at $110 a barrel into May, we will pass the 40% threshold again:
In short, we appear to be on the verge of satisfying the criteria from both models for an Oil shock induced recession. Only the fact that Oil has not made a new all time high appears to be missing.
The fallout:
In February, Prof. Hamilton was optimistic. There had not been any "abrupt drops in consumer sentiment, postponement of purchases of consumer durables, and important changes in the kinds of vehicles consumers buy." The data since then is more ominous. [Note: in all the graphs that follow, gas prices are in blue]:
Consumer sentiment, which had been see-sawing in late 2010
has once again cratered in the last several months:
New car sales declined slightly in March:
In response, Professor Hamilton observed that
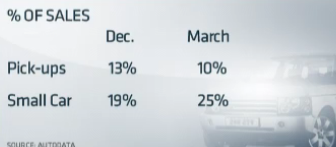
One worry is that gasoline prices are now about the level we saw at the end of April 2008. Interestingly, March 2011 light vehicle sales are also about the same levels as in April 2008. The big difference is, in April of 2008 we were describing those levels as a 14% drop from April of 2006. Now the car manufacturers count themselves lucky to be doing even that well.His worry is borne out by this graphic from a recent CNBC video which shows that in the last few months customers have swung back from buying light trucks to gas-sipping hybrids and compacts:
Truecar CEO Scott Painter said in the video that there had been a significant shift towards gas efficient cars and hybrids just in the last 30 days - similar to that last seen in April 2008.
There are other signs of weakness as well. As I noted last Friday, real retail sales turned negative in March for the first time since last summer's slowdown:
GDP, which had been expected to grow smartly, is now projected to have grown under 2% in the first quarter, similar to 3Q 2006 and 2Q 2010 - and that is before the most recent continuation of the spike:
Rail traffic is still growing, but its relative YoY progess has stalled. In the graph below, the upturn in the last several weeks is exclusively due to intermodal containers used in imports and exports:
Temporary hiring, as measured by the American Staffing Association Index on a weekly basis, has also failed to continue its relative YoY improvement:
The Department of Energy's report of weekly gasoline consumption has also been negative YoY for the last 5 weeks.
The story with Industrial production is more equivocal. It was up .8% in March, but for the last 3 months as a whole its increase has been tepid, but not in any definite way breaking trend from its recession bottom:
Finally, the S&P 500, which normally rises with the price of Oil in expansions, has also failed to make a new high in the last two months, mirroring its stalls of 2006, 2007, and May 2010:
Many of the statistics cited above have only turned down for one month, and one data point obviously does not make a trend. The point is, the data is behaving exactly like we would expect it to behave if we had reached a turning point in an Oil shock.
So, am I calling for renewed recession? Not at this time. While I expect the Leading Economic Indicators report on Friday to be "soft," with the strong housing permits data on Tuesday it will certainly be positive. Typically recessions do not begin until at least 8 of the 10 LEI are negative compared with 6 months previous, or the LEI are down 3 months in a row. Also Real M1 is growing at about 10%, and there has never been a recession going all the way back to the Great Depression with Real M1 positive. Further, Prof. Hamilton's point that many consumers have already made the adjustment to $3.75 gas - via for example their small car purchases several years ago - has a lot of merit.
But if Oil prices remain elevated for several more months, the LEI turning negative becomes more of a possibility. At very least, the Oil shock of 2011 has almost certainly begun, and it is likely already causing a substantial slowdown.
Tuesday, April 19, 2011
The Copper Market; An Overview

The multi-year chart of copper shows that prices are right at levels achieved during the height of the last expansion. Prices -- like most commodities -- crashed hard during the recession, but are now in a clear uptrend. After bottoming, prices rallied, fell to the 200 day EMA (which was also a key Fib level) and continued their advance until meeting resistance at previous levels.
The primary reason for showing the one year chart is to demonstrate that prices have clearly broken a long and therefore important uptrend.

The technical indicators are mixed. The A/D and CMF both show money flowing into the security. However, the MACD shows declining momentum and the primary MACD line is below 0, indicating declining momentum.

The shorter charts shows prices broke out of a downward sloping channel, only to quickly fall back below the upper trend line. The EMAs are neutral, wound in a tight group that is giving away no sign of direction. However, prices are still above the 200 day EMA, indicating we're in a bull market.
Copper has problems from the fundamental side. China has raised interest rates and reserve requirements over the last week. In addition, a copper market glut in China is still possible. The US is also looking at a slowdown, and Japan has plenty of problems. There is also plenty of inflation talk, which will probably be lowering demand for commodities overall. In short, it will be exceedingly difficult for copper to move through current levels.
At this time, I see copper treading water for the next 2-4 weeks, staying below key resistance levels as traders wait to see how the fundamental situation plays out.
Chinese Inflation Is a Central Problem
From the NY Times:
As the United States and Europe struggle to get their economies rolling again, China is having the opposite problem: figuring out how to keep its revved-up growth engine from generating runaway inflation.The latest sign that things were moving too fast came on Sunday, when China’s central bank ordered the biggest banks to set aside more cash reserves.
The move essentially reduces the amount of money available for loans, and is an attempt to cool down the economy. It follows the government announcement on Friday that China’s economy was growing at an annual rate of 9.7 percent, by far the strongest performance by any of the world’s biggest economies.
Because China is now the world’s second largest economy, after the United States, and because the country has been a leading source of global growth during the last two years, money problems here can reverberate from Wal-Mart to Wall Street and the world beyond.
High inflation endangers China’s status as the low-cost workshop for the world. And if the government’s efforts to fight inflation cause the economy to stumble, that will cloud the outlook for international businesses — whether multinationals like General Electric or copper miners in Chile — that have been counting on China for growth.
Inside China, inflation also poses a threat to social stability, a particular worry for Beijing, especially since authoritarian governments in North Africa and the Middle East have become the focus of popular uprisings.
“China’s inflation is a big concern, and actual numbers are worse than officially reported,” said Carmen M. Reinhart, an economist at the Peterson Institute for International Economics in Washington.
She says Beijing is engaged in an economic tug of war, trying to encourage sustainable growth while struggling to control inflation.
Americans Shunning Homes
From Bloomberg:
The most affordable real estate in a generation is failing to lure buyers as Americans like Pauli sour on the idea of home ownership. At the end of 2010, the fourth year of the housing collapse, the share of people who said a home was a safe investment dropped to 64 percent from 70 percent in the first quarter. The December figure was the lowest in a survey that goes back to 2003, when it was 83 percent.“The magnitude of the housing crash caused permanent changes in the way some people view home ownership,” said Michael Lea, a finance professor at San Diego State University. “Even as the economy improves, there are some who will never buy a home because their confidence in real estate is gone.”
Beige Book Part II; Manufacturing
From the Federal Reserve
Boston: Business is good overall at most responding manufacturers. One firm in the chemical business reports that sales are skyrocketing and its plants are running at full capacity. Technology-related manufacturers also report that sales growth continued to be strong in 2011Q1. Revenue growth varied across different business segments at more diversified manufacturers, with some sectors such as health care-related products and transportation seeing rapid sales growth and others experiencing more moderate increases. By comparison, the climate has softened a bit for a medical-device producer as well as an electronic-systems manufacturer because of uncertainty about the federal budget; both firms have a portion of their sales tied to customers that rely on government contracts and/or grants and that seem unwilling to spend until the budget uncertainty is resolved. In addition, a manufacturer heavily tied to residential construction reports a further deterioration in its business as housing markets remain sluggish. Commodity prices continue to be a concern for a number of contacted manufacturing firms; they especially mention price increases for oil, precious metals, corn, and wheat. Some firms have already raised their selling prices in response to these input price increases and others plan to do so as the need arises. Companies who recently raised their prices comment that the increases were accepted easily by their customers. A food products manufacturer notes that there have been few objections because their customers are facing price increases from numerous suppliers. At some firms, these recent price increases do not fully compensate for their inability to raise prices in prior years. As a result, profits are flat at one firm despite its robust sales growth, and some other firms are looking for ways to cut costs further. A number of companies also note rising transportation costs for their goods due to rising diesel fuel prices. In addition, firms that use electronic components in their production are somewhat concerned about supply-chain disruptions in Japan. Inputs from Japan are expected to be in short supply soon (if they are not already) and the extent to which Japanese disruptions will impact firms' costs and/or production is uncertain. Respondent firms' sales exposure in Japan, however, is relatively limited and the revenue impact of the disaster is expected to be fairly small.
Philly: More than half of Third District manufacturers reported increases in shipments and new orders in March -- a stronger response than in February. Producers across a broad spectrum of 13 manufacturing sectors reported increased demand. The strongest reports came out of the fabricated metal products and industrial machinery and equipment sectors. Declines in orders were predominant only among producers of apparel and rubber products. While several manufacturers cited existing customers as the source of increased orders, other sources included new product offerings and expanding international opportunities.
Cleveland: Reports from District factories indicate that new orders and production were mainly steady or up slightly during the past six weeks. Declines were attributed to seasonal factors. Compared to a year ago, production was generally higher, with some of our contacts experiencing low double-digit increases. Manufacturers have a favorable outlook, and they expect at least modest growth during 2011. Steel producers and service centers reported that shipping volume met or exceeded expectations, with shipments being driven by energy-related, transportation, and heavy equipment industries. They anticipate volume remaining at current levels through at least the first half of this year. District auto production dipped slightly during February on a month-over-month basis. Compared to a year ago, domestic auto makers showed a substantial rise in production, while foreign nameplates posted a modest decline.A majority of our contacts indicated that capacity utilization rates continue to trend higher but are somewhat below normal levels. Inventories are balanced with incoming orders. Many of the manufacturers we spoke with said that capital outlays will be higher in the upcoming months relative to year-ago levels. Some noted that projects delayed in 2010 will be started this year. Others said that business conditions warranted raising capital budgets for 2011. Prices for metal and agricultural commodities, steel, and petroleum-based products remain elevated. Many of our contacts reported passing rising input costs through to their customers. A few manufacturers commented that they expect steel prices to begin falling back during the second half of this year. The pace of hiring among manufacturers has picked up since our last report; however, several contacts said that they are using temporary workers instead of creating new positions. Wage pressures are generally contained, with some companies planning to reinstate merit increases.
Richmond: Manufacturing activity continued to expand at a solid pace in March. An auto-parts supplier said that orders at his plant had increased beyond available capacity and he indicated that lead times had increased due to the scarcity of materials. He mentioned that levels of inventories were much lower than desired, and in some cases were nonexistent, causing backlogs of orders for both aftermarket and service parts. Similarly, a packaging manufacturer told us that vendor delay in selected raw materials had affected his company, and he described transportation costs as a growing worry. A manufacturer of dental equipment reported an increase in business throughout his company; he noted that the gains included existing and new accounts. In contrast, several manufacturers who supply products to federal government agencies attributed the lack of new contracts to the uncertainties surrounding the budget for fiscal year 2011, but they expected that business would return to normal once the federal spending issues are resolved. Several textile contacts reported that uncertainty in their raw material markets, exacerbated by the turmoil in the Middle East, had caused prices in petroleum-based products to escalate. More broadly, raw materials prices continued to move higher, according to our latest survey.
Atlanta: District manufacturers noted strong growth in new orders and production. Respondents also signaled stable or higher levels of employment. The majority of manufacturing contacts continued to indicate they will be increasing production in the short-term.
Chicago: Manufacturing production continued to expand in February and March. Activity in the steel, auto, and heavy equipment sectors remained strong. Several contacts reported significant current order backlogs and firming second-quarter order books. Capacity utilization in these industries has increased, but ample idle capacity remains available. For example, a contact in the steel industry noted that active furnaces are operating at high rates of utilization while idled furnaces are expected to be brought back on-line only slowly this year given the high costs of reactivation and uncertainty in the outlook. Lead times continued to lengthen as supply chains were stretched further for some parts. In addition, concerns, and a great deal of uncertainty, were expressed about the potential impact of the Japanese disaster. Contacts expected that supply chain disruptions would take place, although it was too early to tell their full extent. Auto suppliers reported that shortages are most likely to occur first in parts such as electronics, as well as for parts that were already in short supply like tires. Some domestic suppliers have already seen increases in demand for their products as a result. Automakers reported that dealers' vehicle inventories were lean enough to make them consider adding shifts at existing plants; but if parts shortages arise, production schedules may be pared back now and made up as necessary later in the year.
St. Louis: Manufacturing activity has increased since our previous report. Several manufacturers reported plans to open plants and expand operations in the near future, while a smaller number of contacts reported plans to close plants or reduce operations. Firms in the silicone products, rubber products, and military vehicle manufacturing industries reported plans to expand existing operations and hire new workers. Additionally, firms in the electrical equipment and automobile parts manufacturing industries reported plans to open new plants in the District. In contrast, firms in the food, surgical instrument, packaging, and weapons manufacturing industries announced plans to decrease operations and lay off employees.
Minneapolis: Manufacturing output was up since the last report. An April survey of purchasing managers by Creighton University (Omaha, Neb.) showed increases in manufacturing activity in Minnesota, South Dakota, and North Dakota. A consulting firm recently released a survey of 400 Minnesota manufacturing companies, which indicated that 51 percent expect increased sales in 2011 compared with 2010. A tractor maker is expanding into a Minnesota facility. A circuit board producer plans to expand in South Dakota. However, in North Dakota, an electronic components plant plans to close. Surprisingly, 41 percent of manufacturing respondents to a late March ad hoc survey by the Minneapolis Fed indicated they were somewhat unfavorably impacted by the disaster in Japan. One contact noted that plastic resin shipments from Japan have been delayed.
KC: District manufacturing activity expanded rapidly and business activity for high-tech service and transportation firms improved in late February and March. Factory managers reported a surge in production and shipments at both durable and non-durable goods plants. New orders jumped in March, boosting order backlogs as firms replenished finished goods inventories. Raw material inventories rose with some reports of stockpiling to meet anticipated demand and to protect against further price increases. Expectations for future factory orders, production, and shipments remained positive. Some manufacturers were hiring workers, and others expanded the average work week. After softening in the last survey period, sales rose at high-tech service and transportation firms with further improvements expected. Transportation companies struggled to find qualified drivers, and some high-tech firms had difficulty filling specialized positions, such as software developers. With brisk demand, factories and high-tech service firms ramped up capital spending and planned additional hiring.
Dallas: Demand for construction-related products improved slightly, according to most contacts. Even after accounting for pent-up demand following bad weather in early February, cement, glass and primary metals firms and some lumber manufacturers reported some increase in activity. Apartment construction, residential repair and remodeling, and custom commercial projects were said to be driving the uptick. Fabricated metals producers said orders rose, but at a slightly slower pace. While overall activity is at low levels, most construction-related manufacturers' outlooks were more optimistic than they were six weeks ago, although there were some concerns regarding recent world events.
High-tech manufacturing firms said the fallout from the ongoing natural disaster in Japan was the major factor impacting the industry since the last report. Contacts that ship a significant share of output to Japanese factories noted their profits will be negatively impacted, particularly in the first and second quarters of this year. One respondent estimated that shipments coming from at least one factory in Japan may not return to normal until September. Other than events in Japan, most firms said that conditions were stable.
Paper manufacturers said demand had mostly recovered from the slump due to bad weather in January and February. Most firms said demand was stable or improved. Expectations are mostly for stable to improved demand over the next several months, although the longer-term outlook is more uncertain. Manufacturers of transportation equipment said demand was unchanged from the previous report. Outlooks remain cautiously optimistic, although some contacts noted concern about rising fuel costs and global uncertainties. Food manufacturers said orders rose at a moderate pace, and the outlook for sales was positive.
Eleventh District petrochemical producers said domestic demand remained strong for plastics such as polyethylene and polypropylene. Still, higher U.S. prices for some petrochemicals have made exports less attractive. The major exception is PVC which is used in construction, as ample supplies and competitive prices due to low domestic demand have kept exports solid. Refiners said activity had picked up since the last report, with stronger demand for gasoline and oil products. Refinery margins rose despite the increase in crude prices.
Frisco: Manufacturing activity in the District posted further gains during the reporting period of late February into the beginning of April. Makers of commercial aircraft and parts reported modest ongoing growth in new orders, attributed in part to increased demand from airline companies for aircraft with greater fuel efficiency. For manufacturers of semiconductors and other technology products, demand continued to grow, with high levels of capacity utilization and balanced inventories noted. Sales rose further for metal fabricators, although contacts reported minor production challenges arising from constrained supplies of raw materials. Demand remained especially weak for manufacturers of wood products, with the exception of firms in the pulp and paper segment of the industry, which saw increases in orders and output. Petroleum refiners reported slight gains in gasoline sales volumes compared with twelve months earlier, despite the demand constraints arising from higher prices and poor weather, and capacity utilization rates were up accordingly. Demand continued to grow for food manufacturers.
Notes in no order of importance:
-- Japan is a big issue -- bigger than a first glance would indicate. One contact noted the problems would not go away completely until September.
-- Overall, manufacturing is doing extremely well.
-- Several districts noted difficulty in finding skilled workers.
-- The federal government follies are also raising uncertainty.
-- Prices rises across all commodities are being felt by everybody.
-- The only industries not doing well are construction related -- although pulp is doing well because of its application in the paper industry.
At the macro level, we see the following statistics:

Industrial production is still moving higher, although it still has a long way to go before getting to pre-recession levels.
 Capacity utilization is still climbing from its recession low, but also has a bit to go before it makes it to pre-recession levels.

The ISM manufacturing index is reporting some of its strongest numbers in decades, indicating manufacturing is doing very well.
Overall, manufacturing is a clear success story of the current economy.
Monday, April 18, 2011
Treasury Tuesdays
Before moving into this week's Treasury market analysis, I wanted to make a note of long-term levels on the IEFs and TLTs. The general feeling about both of these markets is they are going to eventually start moving lower as inflation fears kick into higher gear and the Treasury gets out of the QEII business.

On the 4 year IEF chart, prices are near important resistance levels, with the first at 92 and the second at 90 -- a few points below current levels.

On the TLTs there are a few more areas of support to move through before we start to see prices moving significantly lower. The lowest of these levels is about 8-10 points below current prices, but that line is fairly weak as it was established by two low points a few years ago. The support lines established by more recent prices are a bit more salient to the current situation.
Last week I wrote the following about the Treasury market:
Let's take a look at the chart, analyzing the IEFs and TLTs in tandem.


Both markets rallied last week, largely by catching a safety bid caused by the EU situation. The US fiscal situation is the least worst kid on the block. The IEFs have risen above the 200 day EMA on increasing volume. However, the EMAs are in a tight range are are offering little directional help. The TLTs also rose on rising volume but are currently hemmed in by the 200 day EMA. Yesterday -- despite the threat of an S&P downgrade -- the Treasury market still rallied because of a worse situation in Europe.
So -- what's ahead for the Treasury market? First, note that IEF prices are above the 200 day EMA and the TLTs are right at the level. In addition, consider these charts:


Both ETFs are in a pretty tight range after falling from highs -- the IEFs from their highest level in the last 7 years and the TLTs from their second highest level. Underlying the current trade is a simple pause as traders "catch their breath" from the recent downward price action.
I'm treating the current action as a consolidation range and would wait to make a trading move until after prices convincingly choose a direction. For the IEFs, that would be a move above 94-94.5 or a move below 92. For the TLTs, it would be a move above 93.5 or a move below 90.
However, it's interesting that despite the current US problems (inflation concerns, budget issues, massive debt), Treasuries are still seen as a safe have trade.

On the 4 year IEF chart, prices are near important resistance levels, with the first at 92 and the second at 90 -- a few points below current levels.

On the TLTs there are a few more areas of support to move through before we start to see prices moving significantly lower. The lowest of these levels is about 8-10 points below current prices, but that line is fairly weak as it was established by two low points a few years ago. The support lines established by more recent prices are a bit more salient to the current situation.
Last week I wrote the following about the Treasury market:
Going forward, I would expect Treasuries to retest the 200 day EMA, perhaps move a touch higher, but then resume their downward trend. The Fed is getting out of the market and the economic numbers on balance are indicating the recovery is self-sustaining (although possibly slowing down). In addition, we have heard more hawkishness from the Fed of late.
... I expect the Treasury market to continue moving lower for the following reasons.
1.) Fed hawkishness
2.) Inflation concerns
3.) The end of QEII
Let's take a look at the chart, analyzing the IEFs and TLTs in tandem.


Both markets rallied last week, largely by catching a safety bid caused by the EU situation. The US fiscal situation is the least worst kid on the block. The IEFs have risen above the 200 day EMA on increasing volume. However, the EMAs are in a tight range are are offering little directional help. The TLTs also rose on rising volume but are currently hemmed in by the 200 day EMA. Yesterday -- despite the threat of an S&P downgrade -- the Treasury market still rallied because of a worse situation in Europe.
So -- what's ahead for the Treasury market? First, note that IEF prices are above the 200 day EMA and the TLTs are right at the level. In addition, consider these charts:


Both ETFs are in a pretty tight range after falling from highs -- the IEFs from their highest level in the last 7 years and the TLTs from their second highest level. Underlying the current trade is a simple pause as traders "catch their breath" from the recent downward price action.
I'm treating the current action as a consolidation range and would wait to make a trading move until after prices convincingly choose a direction. For the IEFs, that would be a move above 94-94.5 or a move below 92. For the TLTs, it would be a move above 93.5 or a move below 90.
However, it's interesting that despite the current US problems (inflation concerns, budget issues, massive debt), Treasuries are still seen as a safe have trade.
Subscribe to:
Posts (Atom)