- by New Deal democrat
All things considered, I'd rather have been wrong yesterday when I said that the jobs consensus was wrong, and to expect only a +50,000 nonfarm payrolls report. With the exception of the ISM services report, virtually every other report this week - ISM manufacturing, concumser confidence, construction spending, factory orders - hit an air pocket. Vendor supplies in the ISM (a leading indicator) will subtract about -.3 from that report. The manufacturing workweek (another component of the LEI) remained flat, and the household survey showed +105,000 jobs, reversing most of last month's loss, which for this week counts as a silver lining.
Turning to the high-frequency weekly indicators:
Oil remained stubbornly above $100 a barrel late Friday. It still remains slightly above 4% of GDP. Gas at the pump fell for the second week in a row, declining $.06 more to $3.79 a gallon. Gasoline usage at 9431 M gallons was 2.8% higher than last year's 9174. This is the first positive YoY comparison in almost three months.
The BLS reported that Initial jobless claims last week were 422,000. The four week average declined to 425,500. We are back at levels last seen late last autumn - but still significantly lower than the rest of last year - and likewise considerably higher from earlier this year.
Railfax was up 2.3% YoY for the week, or 17,600 carloads. The Baseline traffic 4 week moving average is virtually flat, up only 0.07% from a year ago. Cyclical traffic is up 4.25%. Intermodal traffic (a proxy for imports and exports) is 6.42% compared with a year ago.
The Mortgage Bankers' Association reported that seasonally adjusted mortgage applications were flat last week. It was 7.6% higher than this week last year. The purchase series has now been generally flat for over a year, and this is the second week in a row that YoY comparisons in purchase mortgages were positive. Except for the rush at the two deadlines for the $8000 mortgage credit, these are the first YoY increases since 2007. Refinancing decreased 5.7% despite a continued decline in mortgage rates.
The American Staffing Association Index remained at 94 for the third week. This advance continues to look very much like the first half of 2007 - slow growth, but not stalled.
The ICSC reported that same store sales for the week of May 28 increased 2.8% YoY, and increased 0.4% week over week. Shoppertrak reported a very strong 6.0% YoY increase for the week ending May 28 (the third strong week in a row) and a WoW increase of 3.0%. Weekly retail sales numbers have been a bright spot all year, generally showing the consumer not rolling over due to gas prices.
Weekly BAA commercial bond rates decreased another .02% to 5.74%. This yields of 10 year treasury bond decreased .05% to 3.10%. The recent decline in treasury rates do show fear of deflation, and corporate rates have not declined so much, showing a slight increase in relative distress in the corporate market.
Adjusting +1.07% due to the 2011 tax compromise, the Daily Treasury Statement showed that for May 2011, $140.1 B was collected vs. $126.8 B a year ago, for an increase of 11.7% YoY. For the last 20 days, $113.7 B was collected vs. $126.7 B a year ago, for an decrease of $11.8 B, or -0.9%. Use this series with extra caution because the adjustment for the withholding tax compromise is only a best guess, and may be significantly incorrect. Last May was weak and had one fewer workday, so the monthly comparison isn't as great as it looks, and the last 20 days look abysmal.
M1 was up 0.9% w/w, up 1.5% m/m, and up 13.1% YoY, so Real M1 was up 10.1%.
M2 was up 0.1% w/w, up 0.6% m/m, and up 5.1% YoY, so Real M2 was up 2.0%.
Real M1 remains very bullish, while Real M2 remains stuck in the caution zone under 2.5%
Finally, since there is heightened scrutiny of the decline in housing prices recently, this week I am starting to report the weekly update of median asking house prices from over 50 metropolitan areas at Housing Tracker. While a weighted mean would be the most accurate measure, the author of the site does not track that way. Thus I will report the YoY% median change for the areas, plus how many of the YoY% changes are positive, and how many show double-digit declines. I am very confident that when housing prices do bottom, this measure will be the first to show it, and in real time, just as it showed the peak in real time in 2006. This week the median YoY decline is -5.7%. Ten areas showed double-digit YoY% declines and 4 showed YoY% increases in price.
The slowdown is here, the stall is tapping on our shoulders, and the Doomers are close behind murmuring darkly about "green shoots" again. Their perfect record will probably remain intact. Please recuperate safely with the beverage or other vice of your choice this weekend!
Friday, June 3, 2011
Payrolls +54,000; Unemployment to 9.1%
From Bloomberg:
U.S. employers in May added the fewest number of workers in eight months and unemployment unexpectedly rose to 9.1 percent, underscoring Federal Reserve concerns the expansion is failing to boost the labor market.Payrolls increased by a less-than-projected 54,000 last month, after a revised 232,000 gain in April that was smaller than initially estimated, Labor Department figures showed today in Washington. The median forecast in a Bloomberg News survey called for payrolls to rise 165,000. The jobless rate climbed to the highest level this year from 9 percent a month earlier.
.....
Factories cut payrolls in May for the first time in seven months, partly reflecting a drop at motor vehicles and parts producers that may have been related to a components shortage after the earthquake in Japan. Employment at retailers, leisure and hospitality companies and state and local governments also decreased during the month.
.....
Average hourly earnings rose to $22.98 from $22.92 in the prior month, today’s report showed. The average work week for all workers held at 34.4 hours.
There is not much to like in the report, save for the fact that it's one month of bad data. The underlying details -- the drop in manufacturing and construction -- point to the overall manufacturing slowdown we've seen over the last 1-2 months. There are also signs that a Japan related hit is occurring. In addition, I'm thinking that higher fuel prices are leading companies to become more cautious as their respective bottom line takes an energy related hit. High fuel prices also dented the retail employment numbers as consumers cut back on their purchases of non-essential items.
On a scale of 1-10, I'd give this a 2.5, maybe less. The only good thing is it's only one month of data.
Thursday, June 2, 2011
Friday Dollar Analysis
Last week, I wrote the following about the dollar

Prices hit resistance and started to move lower. Also note the EMA picture: all are moving lower, the 10 and 20 are below the 50 and the 10 is about to move below the 20. Prices are also below the EMAs.
This week, we learned that the macro picture for the US economy is weakening as well -- the ISM number dropped, Case Shiller moved lower and initial claims are still above 400,000. There is little reason to see the Fed raising rates anytime soon, meaning the interest rate play won't exist for the dollar. In addition, the weakening economy means the dollar will lose its attractiveness as an investment.
I'd wait for a price rebound into an EMA, and then short.
While prices have moved above the 50 day EMA and the shorter EMAs are moving higher, I am skeptical of the dollar making a big move up at this point. GDP reprinted at the 1.8% level -- which is pretty weak -- and there is little reason the Fed will raise rates anytime soon. I would only be a buyer if prices moved above the longer term moving average. If prices move below the EMAs, I'd wait for a rebound into the EMAs before shorting.Let's take a look at the chart:

Prices hit resistance and started to move lower. Also note the EMA picture: all are moving lower, the 10 and 20 are below the 50 and the 10 is about to move below the 20. Prices are also below the EMAs.
This week, we learned that the macro picture for the US economy is weakening as well -- the ISM number dropped, Case Shiller moved lower and initial claims are still above 400,000. There is little reason to see the Fed raising rates anytime soon, meaning the interest rate play won't exist for the dollar. In addition, the weakening economy means the dollar will lose its attractiveness as an investment.
I'd wait for a price rebound into an EMA, and then short.
ISM Gets Significant Whack
From the ISM

That's a big whack, an indicates the slowdown is real, confirmed, and pretty big.
The rest of the report is actually pretty good. 14 of 18 industries are expanding, and most of the "what participants are saying" focus on rising prices, indicating strong demand. The main problem with this report is the size of the drop in the macro number and its various components, which indicates a fairly strong, abrupt slowdown is occurring.
The report was issued today by Bradley J. Holcomb, CPSM, CPSD, chair of the Institute for Supply Management™ Manufacturing Business Survey Committee. "The PMI registered 53.5 percent and indicates expansion in the manufacturing sector for the 22nd consecutive month. This month's index, however, registered 6.9 percentage points below the April reading of 60.4 percent, and is the first reading below 60 percent for 2011, as well as the lowest PMI reported for the past 12 months. Slower growth in new orders and production are the primary contributors to this month's lower PMI reading. Manufacturing employment continues to show good momentum for the year, as the Employment Index registered 58.2 percent, which is 4.5 percentage points lower than the 62.7 percent reported in April. Manufacturers continue to experience significant cost pressures from commodities and other inputs."Here's a chart from Bloomberg:

That's a big whack, an indicates the slowdown is real, confirmed, and pretty big.
The rest of the report is actually pretty good. 14 of 18 industries are expanding, and most of the "what participants are saying" focus on rising prices, indicating strong demand. The main problem with this report is the size of the drop in the macro number and its various components, which indicates a fairly strong, abrupt slowdown is occurring.
Deficit Reduction Math
Over at the Streetlight, Kash demonstrates that cutting spending is not always a bright idea.
Read the whole thing.
Read the whole thing.
Expect a poor nonfarm payrolls report tomorrow
- by New Deal democrat
As I type this, the consensus is still for a payrolls gain of about +150,000 tomorrow. Based on the poor performance of initial jobless claims in the last month, I am expecting a considerably poorer report, on the order of only +50,000. I base this on the difference between how payrolls behave in the face of rising initial jobless claims vs. falling claims.
Below is an update of my scatter graph comparing initial jobless claims vs. nonfarm payrolls that I first ran several weeks ago. I included the deterioration in jobs leading up to and into the recession in red. Note how the red line traces a very different path than that of the recovery:
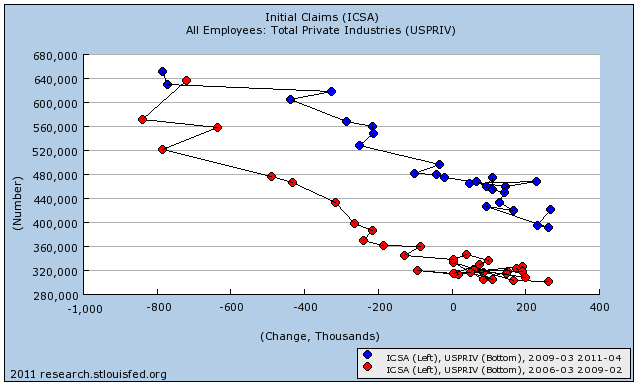
This is why I dismissed the straight line Prof. Delong drew at 400,000 jobs as the dividing point between job growth vs. losses. It simply makes a world of difference whether you are deteriorating into recession, or in recovery coming out of recession, leading to very different scatterplots as above (the same pattern is true for every other postwar recession).
But how should we expect jobs to behave in the face of seriously climbing initial claims? We only have one true example, of a double-dip, and that is the failed 1980 recovery turning into the 1981-82 recession. Here is the scatter graph for that double dip, showing the abortive recovery (blue) and the double-dip (red):
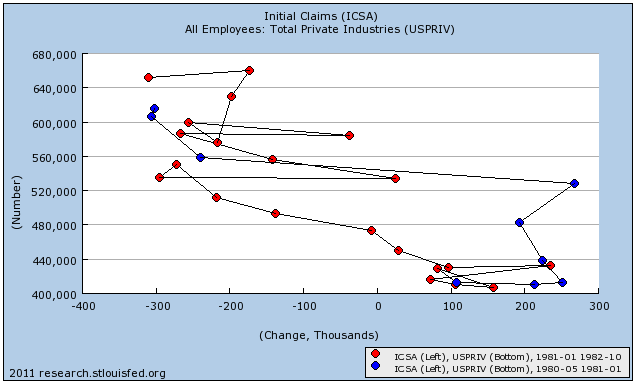
Even with the "summer stall" last year, where GDP only fell to +1.7%, nonfarm payrolls fell into and remained in 5-digit territory. Hence my expectation for tomorrow is that nonfarm payrolls retreat into 5 digits.
If that happens, watch Oil and see if it falls to a new post-April low. Only the real fear of a double-dip will cause the chokehold to loosen.
As I type this, the consensus is still for a payrolls gain of about +150,000 tomorrow. Based on the poor performance of initial jobless claims in the last month, I am expecting a considerably poorer report, on the order of only +50,000. I base this on the difference between how payrolls behave in the face of rising initial jobless claims vs. falling claims.
Below is an update of my scatter graph comparing initial jobless claims vs. nonfarm payrolls that I first ran several weeks ago. I included the deterioration in jobs leading up to and into the recession in red. Note how the red line traces a very different path than that of the recovery:
This is why I dismissed the straight line Prof. Delong drew at 400,000 jobs as the dividing point between job growth vs. losses. It simply makes a world of difference whether you are deteriorating into recession, or in recovery coming out of recession, leading to very different scatterplots as above (the same pattern is true for every other postwar recession).
But how should we expect jobs to behave in the face of seriously climbing initial claims? We only have one true example, of a double-dip, and that is the failed 1980 recovery turning into the 1981-82 recession. Here is the scatter graph for that double dip, showing the abortive recovery (blue) and the double-dip (red):
Even with the "summer stall" last year, where GDP only fell to +1.7%, nonfarm payrolls fell into and remained in 5-digit territory. Hence my expectation for tomorrow is that nonfarm payrolls retreat into 5 digits.
If that happens, watch Oil and see if it falls to a new post-April low. Only the real fear of a double-dip will cause the chokehold to loosen.
Quick Update on the Equity Markets
On Monday, I wrote the following:
The good news in these charts is we are not seeing a massive sell-off; instead the selling is disciplined and meandering. I believe traders are treating the current economic slowdown with a "wait and see" attitude. However, as the sell-off continues, keep your eye on important technical levels as they might indicate a good shorting opportunity. I would not be long right now.
Given yesterdays price action, I'd keep your eyes open. Below are the longer charts of the major ETFs and crucial, short-term support areas to keep in mind. But remember -- keep an eye on the fundamental situation as well. Yesterday's sell-off was caused by the culmination of several weeks of weakening manufacturing news. Friday's employment report will be key. With all of these charts, I'd be using the 200 day EMA as a price target


Thursday Oil Market Analysis
Last week I wrote the following about the oil market:

The 5-minute chart shows that prices have been moving between roughly 99 and 103. In addition, the 104 level still appears to be providing upside resistance to prices, as evidenced by yesterday's drop.
 On the daily chart, I've added two areas at roughly the 96 and 104 level to show where support and resistance are. Prices have not moved beyond eight area in any meaningful way. Also note the 50 day EMA is still providing upside resistance for prices.
The oil market is still trying to figure out a direction. On the upside, we are moving into the summer driving season, which is typically a period of rising oil prices. However, with retail gas prices still near $4/gallon and the economy slowing, traders are also aware that gas can't go much higher without killing US demand. At the same time, developing markets are providing a demand floor; as their respective middle classes have grown, so has their respective oil demand. As such, there is little reason to see a significant price decline -- hence, the reason I thing 96 will provide support going froward.
While I gave 96 as a shorting level least week, this week I would make it the 200 day EMA. In addition, I would still wait until prices moved about the 104 price level as this would get them above technical resistance and through the EMAs.Little has occurred this week to change that opinion.

The 5-minute chart shows that prices have been moving between roughly 99 and 103. In addition, the 104 level still appears to be providing upside resistance to prices, as evidenced by yesterday's drop.
 On the daily chart, I've added two areas at roughly the 96 and 104 level to show where support and resistance are. Prices have not moved beyond eight area in any meaningful way. Also note the 50 day EMA is still providing upside resistance for prices.
The oil market is still trying to figure out a direction. On the upside, we are moving into the summer driving season, which is typically a period of rising oil prices. However, with retail gas prices still near $4/gallon and the economy slowing, traders are also aware that gas can't go much higher without killing US demand. At the same time, developing markets are providing a demand floor; as their respective middle classes have grown, so has their respective oil demand. As such, there is little reason to see a significant price decline -- hence, the reason I thing 96 will provide support going froward.
Wednesday, June 1, 2011
Chicago PMI Drops But Still Positive
From Bloomberg:

Click for a larger image
Notice the drop across the board in the major categories -- production, new orders and order backlogs. While the overall number is still positive, the internals are very concerning. Not only do they confirm the slowdown we've seen, but also indicate the need to be very watchful of the manufacturing numbers going forward.
A big slowdown for month-to-month growth in new orders helped pull down the Chicago PMI by 11 points in May to 56.6 to indicate the slowest rate of monthly growth since November 2009. New orders fell nearly 13 points to 53.5, still over 50 to indicate an increase compared to April but the weakest reading since September 2009. Growth in backlog orders almost entirely evaporated while inventories surged which may suddenly may indicate an unwanted build tied to slowing activity. Delays in deliveries shortened, which is also consistent with general slowing, while production, at 56.0, is still strong but well down from a run of 70 readings. Prices for raw material inputs, at 78.6 and in contrast to most of the readings, did not slow very much. A plus in the report is a comparatively mild slowing in employment, down nearly three points to a still strong 60.8 to indicate solid month-to-month growth in total payrolls as this report includes all areas of the economy. Markets are showing no significant reaction to the report.Let's look at the data from the report:

Click for a larger image
Notice the drop across the board in the major categories -- production, new orders and order backlogs. While the overall number is still positive, the internals are very concerning. Not only do they confirm the slowdown we've seen, but also indicate the need to be very watchful of the manufacturing numbers going forward.
Oil Prices and the Recovery (revisited)
- by New Deal democrat
I've been writing about this topic for well over a year, and here we are again.
Reading the punditry is an excellent exercise in watching cognitive psychology at work. If you are a gold-bug like Mish, then the slowdown is about money printing. The Fed must be abolished and the gold standard re-adopted. If you are the Calafia Beach Pundit (Scott Grannis), then the slowdown is about the failure of Keynesian stimulus. To the contrary, if you are Paul Krugman, then the slowdown is about the inadequacy of the stimulus. And if you are Robert Reich, it is about failure to put spending power in the hands of ordinary Americans.
In short, the slowdown is like a Rohrshach blot onto which pre-existing worldviews are projected.
It ought to be clear that my political sympathies are with Krugman and Reich, but I'm not sure we need a particularly sophisticated explanation for the slowdown. Making use of Occam's razor, we can simply say that it is all about Oil prices. Here is a graph for the last 6 years of inflation-adjusted Oil prices where January 2010 prices = 1, where Oil analyst Steve Kopits' metric of Oil at 4% of GDP = $90 (blue). Real GDP growth is in red (*25 to make use of the same scale):
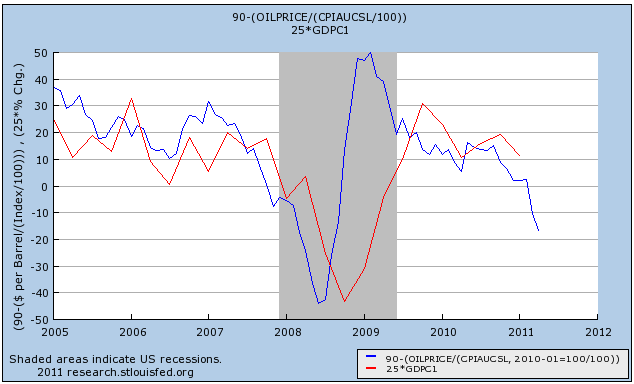
Over that time period, simply knowing the "real" price of Oil has been an excellent forecasting tool for GDP in the same or next quarter. (You may recall that Prof. James Hamilton found that his energy price shock model explained about half of the decline in the great recession).
As to other suggested contributing factors, Japan has just shifted demand back a quarter or two. If production slows now due to an availability of parts, it will make up the difference once the parts supply returns to normal.
As to Europe, if it were a real problem, we would see financial fear spiking again. To the contrary, as I pointed out last week, both the TED spread and LIBOR are comatose.
So the stop-and-go recovery comes back to a lack of a sustainable strong increase in consumer demand. Part of that is housing still being flat on its back, part of it is stagnating if not declining household wealth and near-deflation in wages. And how much consumers do have to spend in the productive economy depends very much on the wildly fluctuating price of Oil, which in turn is serving as a choke collar, cutting off the oxygen flow every time the recovery starts to run.
I've been writing about this topic for well over a year, and here we are again.
Reading the punditry is an excellent exercise in watching cognitive psychology at work. If you are a gold-bug like Mish, then the slowdown is about money printing. The Fed must be abolished and the gold standard re-adopted. If you are the Calafia Beach Pundit (Scott Grannis), then the slowdown is about the failure of Keynesian stimulus. To the contrary, if you are Paul Krugman, then the slowdown is about the inadequacy of the stimulus. And if you are Robert Reich, it is about failure to put spending power in the hands of ordinary Americans.
In short, the slowdown is like a Rohrshach blot onto which pre-existing worldviews are projected.
It ought to be clear that my political sympathies are with Krugman and Reich, but I'm not sure we need a particularly sophisticated explanation for the slowdown. Making use of Occam's razor, we can simply say that it is all about Oil prices. Here is a graph for the last 6 years of inflation-adjusted Oil prices where January 2010 prices = 1, where Oil analyst Steve Kopits' metric of Oil at 4% of GDP = $90 (blue). Real GDP growth is in red (*25 to make use of the same scale):
Over that time period, simply knowing the "real" price of Oil has been an excellent forecasting tool for GDP in the same or next quarter. (You may recall that Prof. James Hamilton found that his energy price shock model explained about half of the decline in the great recession).
As to other suggested contributing factors, Japan has just shifted demand back a quarter or two. If production slows now due to an availability of parts, it will make up the difference once the parts supply returns to normal.
As to Europe, if it were a real problem, we would see financial fear spiking again. To the contrary, as I pointed out last week, both the TED spread and LIBOR are comatose.
So the stop-and-go recovery comes back to a lack of a sustainable strong increase in consumer demand. Part of that is housing still being flat on its back, part of it is stagnating if not declining household wealth and near-deflation in wages. And how much consumers do have to spend in the productive economy depends very much on the wildly fluctuating price of Oil, which in turn is serving as a choke collar, cutting off the oxygen flow every time the recovery starts to run.
Dr. Copper Knows All
Last week, I posted on copper. Today we have a great chart from Dr. Ed on the relationship between copper prices and the stock market.

That chart is one of the reasons copper prices are so important.

That chart is one of the reasons copper prices are so important.
Tuesday, May 31, 2011
Wednesday Commodity Round-Up
Last week, we looked at copper. This week, I'll be looking at gold to see what the pace of the recent sell-off is doing to the market.

On the longer chart (1-year) notice that uptrends are still intact, despite the current sell-off.

On the shorter chart, prices fell to the 50 day EMA, rose and fell back and are now meandering their way higher. The EMAs are in a bullish orientation and the A/D, CMF and MACD are all signaling a move higher.
However, I would wait on making a move until prices move above previous highs. Other commodities are dropping in price (or at least not moving meaningfully higher) and there is concern about a global slowdown in play. With commodities moving lower there is less inflationary pressure, implying lower gold demand. As such, I think the highest probability for gold is a sideways consolidation in either a triangle or rectangle pattern. I believe there is still enough concern regarding inflation to keep a floor under prices for now.
Indian Growth Slows
From the WSJ:
Gross domestic product expanded 7.8% on-year as growth in mining and manufacturing output weakened, the government said Tuesday. The reading was below the median expectation for 8.2% expansion, according to a poll of 19 economists. The economy had expanded 8.3% in the October-December quarter.For the full fiscal year ended March 31 the economy grew a provisional 8.5%, in line with the government's projection of 8.6%. That was well ahead of the 8.0% growth in the previous fiscal year, when the economy was shrugging off the effects of the global economic crisis.
By way of background, the BRIC economies are all seeing banks raise rates and/or reserve requirements to slow growth in an effort to slow inflation. These markets have been very important to US growth, especially for manufacturing. While the growth rate is still impressive -- and is hardly a problem in the long-run -- it will probably add further weight to the US slowdown at a time when it is least needed.
The "Growth Problem"
From the WSJ:
The world's largest economy may be facing a growth problem.After a disappointing first quarter, economists largely predicted the U.S. recovery would ramp back up as short-term disruptions such as higher gas prices, bad weather and supply problems in Japan subsided.
But there's little indication that's happening. Manufacturing is cooling, the housing market is struggling and consumers are keeping a close eye on spending, meaning the U.S. economy might be on a slower path to full health than expected.
"It's very hard to generate a rapid recovery when rapid recoveries are historically driven by housing and the consumer," said Nigel Gault, an economist at IHS Global Insight. He expects an annualized, inflation-adjusted growth rate of less than 3% in coming quarters—better than the first-quarter's 1.8% rate, but too slow to make a meaningful dent in unemployment.
A growing number of forecasters are downgrading their second-quarter growth predictions. JPMorgan Chase & Co. economists revised down their estimate to a 2.5% rate from 3%, while Bank of America Merrill Lynch economists cut theirs to 2% from 2.8%. Deutsche Bank cut its forecast to 3.2% from 3.7%.
Companies are similarly cautious. Applied Materials Inc., the largest maker of machines used in producing computer chips, said it expected growth in its semiconductor and solar markets to slow following one of its best quarters ever. Hewlett-Packard Co. cut its fiscal-year outlook amid weak computer sales and negative effects from the disaster in Japan. Clorox Co. offered a more guarded outlook for its household goods business as executives noted that higher prices may hurt sales.
The dimming outlook raises a deeper question about the economy's health: Has it emerged from the financial turmoil of 2008 and 2009 with a chronic growth problem?
Some economists think it has. "We keep expecting the economy to perform along norms that are very difficult to achieve when you have this much private debt and public debt," said Carmen Reinhart, an economist at the Peterson Institute for International Economics. She thinks the Federal Reserve's forecasts have been too optimistic, and the U.S. could be in for a protracted period of subpar growth and high unemployment.
Let's make a few, important points.
1.) No one is calling for a recession -- although expect that call to start back up again with stories like this.
2.) There are several contributory problems: a consumer who is spending less, housing is still weak and I would add a slowdown in emerging markets which was driving the resurgence in manufacturing as well as austerity measures at the federal and state level.
3.) The good news about the recent slowdown is this: it will cause weaker commodity demand, which will help stave off the inflationary calls and high gas prices. The drop in gas prices may add a quiet boost to the economy.
Treasury Tuesdays
Last week I wrote the following about the Treasury market:

The IEFs are in a strong position. Prices are using the EMAs for technical support. All the EMAs ar e moving higher and the shorter EMAs are above the longer. The A/D line shows money is flowing into the market, but the CMF is showing decreasing interest. Also note the MACD -- while still giving a buy signal -- is still positive.

The long-end of the curve shows the same issues as the IEFs. However, prices need to move through resistance.
I would still be long Treasuries right now. There is little reason to think the Fed will raise rates anytime soon. The economy is slowing down, which will probably decrease inflationary pressures. There is still concern about the EU situation, making safer asset more attractive. Also adding to the attraction is the lack of upward movement in the stock market and decrease in commodities. I would still use 2.75% on the 10 year as a line to look for (a commenter asked why I chose that number. The answer is it's a round number that the bond market likes).
The Treasury market is benefiting from concern about the stock market and the EU situation. Interestingly enough, there does not appear to be any concern on the part of bond traders regarding the budget situation in Washington. However, as I mentioned last week, remember that on the other side of price is yield. I would use 2.75% as the possible low on the yield front, but that's simply a decent round number to use.Let's go to the charts:
It's important to remember that on the fundamental front, the Treasury market is the primary market to invest in right now. As such, it's benefiting from the increased concern about the economy and the EU situation.

The IEFs are in a strong position. Prices are using the EMAs for technical support. All the EMAs ar e moving higher and the shorter EMAs are above the longer. The A/D line shows money is flowing into the market, but the CMF is showing decreasing interest. Also note the MACD -- while still giving a buy signal -- is still positive.

The long-end of the curve shows the same issues as the IEFs. However, prices need to move through resistance.
I would still be long Treasuries right now. There is little reason to think the Fed will raise rates anytime soon. The economy is slowing down, which will probably decrease inflationary pressures. There is still concern about the EU situation, making safer asset more attractive. Also adding to the attraction is the lack of upward movement in the stock market and decrease in commodities. I would still use 2.75% on the 10 year as a line to look for (a commenter asked why I chose that number. The answer is it's a round number that the bond market likes).
Monday, May 30, 2011
Equity Week in Review and Preview of the Upcoming Week/Month
Last week I wrote the following about the markets:

The SPYs are currently in a controlled, downward sloping channel. The A/D line is not showing a significant move in or out of the security, but the CMF is showing that action. The MACD is decreasing, but may be about to give a buy signal. The EMA signal is jumbled; the EMAs are in a tight band, indicating a lack of overall direction.

The QQQs long-term chart shows that prices have clearly broken an important trend line.

The shorter chart shows the trend break with far more clarity. Also note the similar technical picture as the SPYs. Also note that prices are using the EMAs as technical resistance -- a bearish sign.

The longer IWMs also show a clean trend break.

There is little more to say about the IWMS shorter chart that has not already been said.
The good news in these charts is we are not seeing a massive sell-off; instead the selling is disciplined and meandering. I believe traders are treating the current economic slowdown with a "wait and see" attitude. However, as the sell-off continues, keep your eye on important technical levels as they might indicate a good shorting opportunity. I would not be long right now.
In short, the technicals of the market are now signaling more caution signs. Important, long-term trend lines have either been broached or are currently very close to being broken. Underlying technicals (A/D, CMF, MACD) are weakening. This mirrors the issues with the fundamental economy right now, which is also showing signs of weakness. In short, I would not be looking for any long opportunities right now. If you've made money over the last few months, I'd take some profits off the table. And I'd also be looking for a shorting opportunity if it presented itself.Nothing has changed in my analysis for the equity markets. Consider the following charts:

The SPYs are currently in a controlled, downward sloping channel. The A/D line is not showing a significant move in or out of the security, but the CMF is showing that action. The MACD is decreasing, but may be about to give a buy signal. The EMA signal is jumbled; the EMAs are in a tight band, indicating a lack of overall direction.

The QQQs long-term chart shows that prices have clearly broken an important trend line.

The shorter chart shows the trend break with far more clarity. Also note the similar technical picture as the SPYs. Also note that prices are using the EMAs as technical resistance -- a bearish sign.

The longer IWMs also show a clean trend break.

There is little more to say about the IWMS shorter chart that has not already been said.
The good news in these charts is we are not seeing a massive sell-off; instead the selling is disciplined and meandering. I believe traders are treating the current economic slowdown with a "wait and see" attitude. However, as the sell-off continues, keep your eye on important technical levels as they might indicate a good shorting opportunity. I would not be long right now.
Subscribe to:
Posts (Atom)