we're seeing a decline in gasoline demand instead of a recession.
- by New Deal democrat
I. The simplistic argument that lower gasoline usage means a contracting economy has been contradicted by the facts for nearly three years. Back in March of last year, in my Weekly Indicators column, I first noted that gasoline consumption had turned negative YoY. The comparisons grew more negative by July, and at the end of October, I noted that in that week gasoline demand was down almost 10%. This YoY decline has continued, and in the last month nearly every Permabear has weighed in, for example Mish, Charles Hugh Smith, cross-posted (of course) at Zero Hedge, .and of course the obligatory Doomer at Daily Kos. James Bianco is more nuanced, saying that
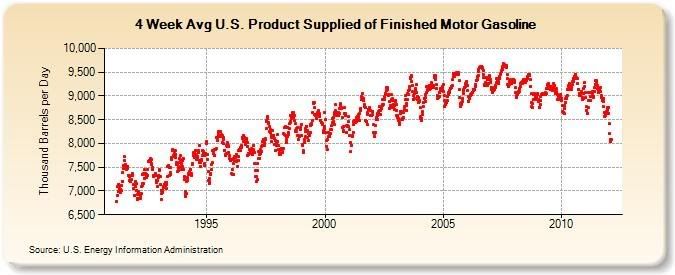
it comes as a surprise that these measures of broad-based economic activity (gasoline consumed and miles driven) are falling hard at a time when most economists are in agreement that the economy has been getting better in recent months. If the economy is indeed getting better, it seems to be happening while we are driving less and consuming less gasoline. For the American economy, this is really hard to do....Typically these analyses are accompanied by a graph of gasoline delieveries from the E.I.A., such as this one:
We would not suggest that these economic indicators trump all others and the economy is actually worsening. But it is disconcerting that these measures of critically economic activities are heading lower in a hurry.
The argument is pretty simple: As Smith puts it: "Gasoline deliveries reflect recession and growth. The recent drop in retail gasoline deliveries is signalling a sharp contraction ahead." Since gasoline demand has plummeted, ergo we are entering a sharp recession. QED.
There's just one problem with this simple analysis -- well, actually, two. Do you remember the double-dip recessions of 2010 and 2011? You don't? Probably because, they didn't happen. And yet throughout most of that period, gasoline demand was also down, sometimes strongly so, year over year.
The above graph is very noisy. We can see that in general there has been a decline in gasoline demand over the last 4 years, but not much more than that. Further, you can easily see that gasoline usage is seasonal, rising into summer and then declining into winter. Absent a seasonal adjustment, it has to be measured year over year.To give a better view of what has been happening each month for the last 5 years on a YoY basis, I prepared a simple chart. This chart below is pretty basic, but it compares YoY demand from January 2008 to the present. If YoY demand was higher, that is signified with an h or H, if lower, with an l or L. If gasoline demand was higher/lower than the previous year by less than 200,000 barrels a day, the h or l are in lower case. In those cases where there was more than a 200.000 barrel a day difference, the H or L are in upper case. Finally, I've added added in GDP for each quarter, shown in the ending month of that quarter, to show how well or poorly the two correlated. Here's the chart:
| Month | 2007 | 2008 | 2009 | 2010 | 2011 | 2012 |
|---|---|---|---|---|---|---|
| January | --- | l | L | l | h | L |
| February | --- | l | h | l | h | L |
| March | --- | l (-1.8%) | l (-6.7%) | l (+3.9%) | l (+0.4%) | --- |
| April | ---- | l | l | h | l | --- |
| May | ---- | l | l | l | l | --- |
| June | --- | l (+1.3%) | l (-0.7%) | h (+3.8%) | l (+1.3%) | --- |
| July | --- | L | l | h | L | --- |
| August | h | l | L | h | l | --- |
| September | l | L (-3.7%) | h (+1.7%) | l (+2.5) | L (+1.8%) | --- |
| October | l | L | h | l | L | --- |
| November | h | L | h | l | L | --- |
| December | l (+1.7%) | L (-8.9%) | l (+3.8%) | H (+2.3%) | L (+2.8%) | --- |
The decline in gasoline usage during the last recession is pretty straightforward, and it shows that the drop-off in gasoline demand intensified as the recession itself did. But here's the thing: notice that YoY demand in gasoline continued negative for 9 of the 12 months after the recession was over. Only in the second half of 2010 through March 2011 was it consistently positive. For the last 11 months, gasoline demand has been almost relentlessly negative again, and strongly so since August. Indeed, gasoline demand has been negative YoY for 22 of the 32 months since the end of the recession in June 2009.
Further, while gasoline demand and GDP correlate well during the 2008-09 recession, the relationship if anything inverts thereafter. The two weakest quarters of 2011 (Q1 and Q2) featured higher relative gasoline demand. Q3 and Q4 of 2011, which showed very negative YoY gasoline demand, were the two strongest quarters. Finally, note that the quarter with the highest GDP in the last 4 years, Q1 of 2010, featured negative YoY gasoline demand in every month.
If a basic chart isn't sophisticated enough for you, here's a graph showing YoY changes in gasoline demand since 2007:

[h/t SilverOz]
YoY gasoline demand actually first went slightly negative in October 2007, and hit its nadir in the last quarter of 2008 coinciding with a near-10% contraction in annualized GDP. If the same relationship applied now, we should have been in recession for the last year, and we should be seeing nearly a million jobs lost per month now. Does anyone think that's the case?
The simple fact is that the argument that higher / lower gasoline demand = higher / lower economic activity has been demonstrably wrong for nearly 3 years.
II. But if the decline in gasoline demand has behaved differently in the last three years than at the time of the "great recession," what's different? For that, we need to examine not just gasoline sales, but how gasoline sales compare with other retail sales. And we have to go beyond that, to look at how much the consumer is able to spend.
Let's begin with this graph, courtesy of Bill McBride a/k/a Calculated Risk, showing retail sales, and retail sales ex-gasoline, beginning in January 2006:

Notice that the two generally moved in tandem, but then diverged a few months before the beginning of the "great recession." It is not an exaggeration to say that the decline in retail sales ex gasoline was the immediate herald of the recession. In fact, the graph shows that the 2007-08 Oil shock, which featured gasoline prices in excess of $4 a gallon, fully explains half of all the decline in sales during the "great recession." Notice further that there has been no such divergence since, up to and including the present.
To better examine this, let me show you a few charts of total retail sales, retail sales of gasoline, and retail sales ex-gasoline, since 2006. The first shows the three categories of retail sales from June 2007 through September 2008. All figures are seasonally adjusted. (bolding denotes peak):
| Month | retail sales | gas sales | retail sales ex gas |
|---|---|---|---|
| Jun 2007 | 368758 | 37207 | 331551 |
| Jul 2007 | 370046 | 37055 | 332991 |
| Aug 2007 | 371409 | 37089 | 334320 |
| Sep 2007 | 375937 | 38832 | 337105 |
| Oct 2007 | 374909 | 38760 | 336149 |
| Nov 2007 | 378433 | 42001 | 336432 |
| Dec 2007 | 377232 | 41628 | 335604 |
| Jan 2008 | 376847 | 42492 | 334370 |
| Feb 2008 | 372843 | 42477 | 330366 |
| Mar 2008 | 373741 | 43198 | 330543 |
| Apr 2008 | 375681 | 43330 | 332351 |
| May 2008 | 376866 | 44310 | 332556 |
| Jun 2008 | 377893 | 46158 | 331735 |
| Jul 2008 | 375530 | 46742 | 328788 |
| Aug 2008 | 373985 | 45567 | 322599 |
| Sep 2008 | 368166 | 45496 | 322670 |
During this time, gasoline sales rose by 1/3 from just under $35 million to $47 million. Retail sales ex-gasoline, however, rose only 1.5%, peaking in September 2007 and then consistently declining. Overall retail sales peaked in November 2007. From September 2007 through July 2008, overall retail sales declined less than 1%, while retail sales ex gasoline fell by about 2.5%. In other words, from a period a few months before the recession until well into it, consumers were curtailing non-gasoline purchases in order to try to keep up with the rising cost of gas (even so, they purchased less than half of what it would actually take to keep up).
The next chart shows early 2009 (bolding indicates recession lows):
| Month | retail sales | gas sales | retail sales ex gas |
|---|---|---|---|
| Dec 2008 | 333767 | 27739 | 306028 |
| Jan 2009 | 338841 | 28506 | 310335 |
| Feb 2009 | 337840 | 29774 | 308066 |
| Mar 2009 | 332672 | 28779 | 303893 |
| Apr 2009 | 333347 | 28775 | 304572 |
| May 2009 | 336228 | 30290 | 305938 |
| Jun 2009 | 340803 | 32792 | 308011 |
The important point here is that once again the turn higher in retail sales ex gasoline heralded the bottom of the recession several months later.
Having established the importance of the relative performance of retail sales ex gasoline, let's look at the same data since gasoline prices again began to rise over $3 a gallon in September 2010:
| Month | retail sales | gas sales | retail sales ex gas |
|---|---|---|---|
| Sep 2010 | 366417 | 37937 | 328480 |
| Oct 2010 | 370676 | 38993 | 331683 |
| Nov 2010 | 373952 | 39698 | 334254 |
| Dec 2010 | 376487 | 41292 | 335195 |
| Jan 2011 | 379332 | 41858 | 337474 |
| Feb 2011 | 384044 | 42802 | 341242 |
| Mar 2011 | 386690 | 44427 | 342263 |
| Apr 2011 | 387705 | 44864 | 342841 |
| May 2011 | 387522 | 45155 | 342367 |
| Jun 2011 | 388284 | 44327 | 343957 |
| Jul 2011 | 389934 | 44763 | 345171 |
| Aug 2011 | 391074 | 44978 | 346096 |
| Sep 2011 | 396049 | 45232 | 350817 |
| Oct 2011 | 398645 | 45082 | 353563 |
| Nov 2011 | 399796 | 45514 | 354282 |
| Dec 2011 | 399869 | 44341 | 355528 |
| Jan 2012 | 401400 | 44946 | 356454 |
Note that on a seasonally adjusted basis, purchases of gasoline rise from then until March of last year, and since then have remained quite stable at $44-$45 million in sales per month. In contrast to 2007-08, look at what happened to retail sales ex gasoline. Sales ex gasoline did stall in the first quarter of 2011, coinciding with gas and total retail sales almost identical to those of late 2007. But since May 2011 retail sales ex gasoline have risen from $342 million to $356 million, a 4% increase in 8 months!
In contrast to 2007-08, where consumers cut back on other purchases in order to purchase gasoline, in 2011-12 consumers are reining in purchases of gasoline in order to consume other products! Put another way, the decline in gasoline demand isn't happening because of a recession, it's happening instead of a recession.
III. It appears that gasoline conservation is a top priority of consumers. There is precedent for a permanent change in consumer behavior. Between 1978 and 1982. as "gas prices shot up, and consumers responded by driving less and buying more efficient cars so that by 1982 they consumed 12 percent less gasoline than in 1978." Specifically,
In 1978, U.S. gasoline consumption was about 7.4 million barrels per day. By 1981, ... U.S. gasoline consumption had fallen [to] ... about 6.5 million barrels per day. [It was not until] ... 1993 [that] U.S. gasoline consumption rose above 1978 levels.This has been recognized as a permanent change in demand due to the adoption of widespread energy efficiencies.
While there is no single action that explains the recent decrease in demand for gasoline, there are any number of statistics evidencing that in 2011, consumers decided to cut back on gas usage in a number of substantial ways. For example:
1. Ridership of mass transit is up:
Ridership on public buses and trains increased 2%[in 2011] — from 7.63 billion rides to 7.76 billion, according to the American Public Transportation Association.2. Ridership of intercity luxury buses (e.g., MegaBus and BoltBus) is up. Any driver stuck in an Interstate traffic jam has probably looked longingly at passengers lounging in these buses over in the next lane. And commuters have acted:

3. Online retail purchases have risen to 5.5% of total retail sales.
4. Automakers are selling more energy efficient compact, hybrid, and electric vehicles, as shown in this graph:

While towards the end of 2011 as gas prices decreased, SUV sales went up, in general car buyers have downsized from midsized to smaller sedans. Se also here, here, here, here, and here.
5. Vehicles themselves are becoming more energy efficient, by the biggest margin in years. In 2006, according to the Department of Transportation, the average fuel efficiency for a new vehicle in 2006 was 30.1 miles per gallon. In 2011 it was 33.8, a more than 10% improvement. Light duty trucks including typical SUVs, averaged 22.5 miles per gallon in 2006. In 2011, that was to 24.5, a 9% improvement.
6. Fewer teenagers are getting licenses, "with the decline accelerating rapidly since 1998." Time magazine reports that:
There’s a smaller proportion of 20-somethings on the road nowadays as well: In recent times, 22% of drivers were under age 30, compared to roughly one-third of the licensed-driver population in 1983.7. Multi-vehicle households are making a more strategic allocation of vehicle usage, as the Department of Transportation reported even in 2008. This advice was commonplace by 2011, when for example Nursing Link recommended, "If both spouses drive to work in separate cars, use the more fuel-efficient one for the longest commute." Anecdotally, my daily commute in a large metropolis area causes me to use two of the most travelled expressways in the entire area. Whereas about 5 years ago it seemed that full-size SUVs made up about 1/3 of all vehicles on the expressways, noticeable because they formed an impenetrable visual wall in front of sedan drivers, on most days recently I have seen less than half a dozen full-size SUVs combined on either expressway. Sedans, especially smaller sedans, make up about 85% of all vehicles on the expressways, with pick-up trucks, crossovers and smaller SUVs making up the rest. I have no way of being able to prove the general applicability of this observation, but if it is true, it constitutes a major efficiency in gasoline usage.
The shift toward an older average driver has to partly be explained by the general aging of the population. .... But researchers point out that the decrease in young drivers may be attributable to ... the availability of virtual contact through electronic means [which] reduces the need for actual contact among young people,” said Michael Sivak, research professor at the U-M Transportation Research Institute....
Sivak’s research appears to indicate that teenagers think traffic congestion and high fuel costs are the real nightmares, taking up time and money that could otherwise be spent on electronic communication.
8. Trip compression. In response to a return to near $4 a gallon prices last spring, Nielsen reported that "Sixty-seven percent of consumers say they are combining errands and trips as a result of high gas prices."
While no single trend can account for the steep decline in gasoline demand, together these amount to a very powerful consumer reaction.
IV. But the consumer allocation between gasoline and other retail sales isn't the entire explanation. Retail sales in total stalled before the end of 2007, and yet they rose strongly in the second half of 2011. Considering that wages have not kept pace with inflation for over a year, where are consumers getting the money to spend?
The answer is, savings acquired during the "great recession." Remember that by the end of 2006, Americans' saving rate was essentially zero. Personal saving for the entire economy were about $200 billion. As the next graph shows, that all changed during and after the "great recession":

The personal savings rate (red, right scale) went from 2% to 8% at its high. Another $600 billion was added in personal savings (blue, left scale), constituting fuel that could be poured on the economic fire. Note further, however, that over half of that store of saving was depleted in 2011, used to make up for the decline in real wages. Thus, while the decline up until now of gasoline demand does not signal a downturn, a sharp or sustained further spike in price may yet produce an Oil shock contraction. As I already noted from the final chart above, it appears that consumer spending on other items did stall in spring of last year due to that price spike. We missed a recession, but at +0.4% GDP growth, not by much.
So while it's impossible to say how long consumers will continue to be able to fuel general spending by constricting gas purchases, we can say that they are significantly more vulnerable to an oil price shock -- say, of $4.50 a gallon gas by Memorial Day, than they have been in several years. In that regard, note the spike upward in savings in December. That may just be noise, but if it instead marks the beginning of renewed consumer belt-tightening, there might yet be a further decline in gasoline demand, that would indeed mark a recession.
What we can say is, it's not here yet. And the precipitous decline in gasoline demand for the last 11 months does not mean it is necessarily coming at all.
IV. But the consumer allocation between gasoline and other retail sales isn't the entire explanation. Retail sales in total stalled before the end of 2007, and yet they rose strongly in the second half of 2011. Considering that wages have not kept pace with inflation for over a year, where are consumers getting the money to spend?
The answer is, savings acquired during the "great recession." Remember that by the end of 2006, Americans' saving rate was essentially zero. Personal saving for the entire economy were about $200 billion. As the next graph shows, that all changed during and after the "great recession":
The personal savings rate (red, right scale) went from 2% to 8% at its high. Another $600 billion was added in personal savings (blue, left scale), constituting fuel that could be poured on the economic fire. Note further, however, that over half of that store of saving was depleted in 2011, used to make up for the decline in real wages. Thus, while the decline up until now of gasoline demand does not signal a downturn, a sharp or sustained further spike in price may yet produce an Oil shock contraction. As I already noted from the final chart above, it appears that consumer spending on other items did stall in spring of last year due to that price spike. We missed a recession, but at +0.4% GDP growth, not by much.
So while it's impossible to say how long consumers will continue to be able to fuel general spending by constricting gas purchases, we can say that they are significantly more vulnerable to an oil price shock -- say, of $4.50 a gallon gas by Memorial Day, than they have been in several years. In that regard, note the spike upward in savings in December. That may just be noise, but if it instead marks the beginning of renewed consumer belt-tightening, there might yet be a further decline in gasoline demand, that would indeed mark a recession.
What we can say is, it's not here yet. And the precipitous decline in gasoline demand for the last 11 months does not mean it is necessarily coming at all.