
Yesterday's 5 minute chart shows prices falling consistently until 2:30 and then steadying out. This is a classic sell-off pattern. Notice how the 5-minute EMA became the resistance for any moves for the first 2/3-3/4 of the trading day. Also note the volume acceleration right around noon.

The 30 minute chart shows the action of the last two days clearly. Yesterday (9Apr) we see prices gap lower, but then rally a bit during the day. Yesterday, we see prices sell off hard throughout the day.

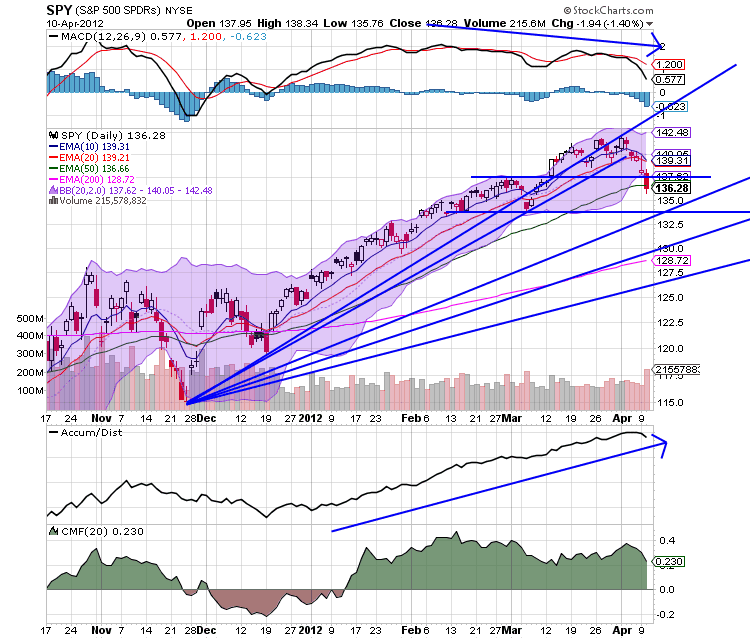
The daily chart shows that prices moved through key support yesterday in the 137.5 price area, along with the 50 day EMA. The next price target is a little below 134. Also note the increase in volume today.

The above chart has the Fib levels, with the nearest one being 132. That would only be a fall of 7.17% from the high, so it wouldn't be a bear market, but instead a correction.
The Fib fans place the first level of support around the 133.5 area.
To people who read this blog, this sell-off should not be a surprise. I've disliked this rally since the beginning, and reluctantly became a bull as prices continued to move higher (never fight the trend). But the lack of movement in the Russell 2000 and transports has been a concern. In addition, the fact the other major equity indexes through the world are all in come form of stall or correction was also a point of deep concern.