I really set myself up for failure in January with my forecast for this year of weakness in the first half, most likely in the first quarter and probably as bad as 2006 but not quite as bad as the recession of 2001, followed by strength in the second half. That's a really narrow passage to navigate!
A nuanced forecast like that also means I'm not being uniformly bullish or bearish, and at least when my stuff gets cross-published at places where nuance isn't exactly a prized commodity it isn't a ticket to popularity.
Initial strength has been followed by progressive weakness that started with a poor March payrolls report. Consumers whose incomes in real terms have fallen in the last two years have started to increase their savings again, meaning less consumption and a slowdown in that major component of the economy. Despite that, I'm still expecting the weakness to end this summer sometime, partly because
- (1) the long leading indicators of housing permits and starts, interest rates, and money supply all turned positive by the second quarter of last year and have continued to be positive. By the time 18 months passes, all of those should be filtering through to improvement in the overall economy.
- (2) gasoline prices hit their seasonal peak at about the same level as last year, and have already backed off over 10%, putting more money in consumers' pockets, and
- (3) past patterns of inflation and deflation suggest that when YoY price deflation is at its worst, that is when the economy is at its slowest, improving thereafter.
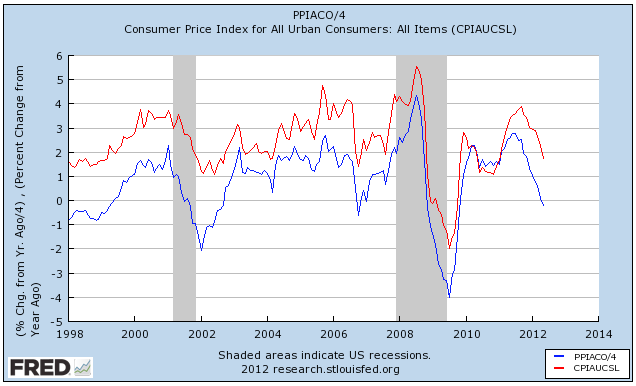
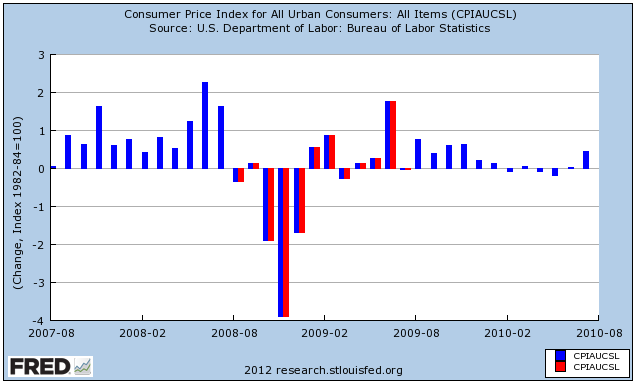
As you can see, YoY consumer and producer prices both bottomed out immediately after the bottom of both recessions - 2 months later in the first, 1 month later in 2009.
Since 11 of the 12 data points in a YoY comparison stay the same with each new month, another way to look at this comparison is to compare any given data point with the same month one year before. If the newer year is higher/lower than the same month the year before, then the YoY comparison is also higher/lower.
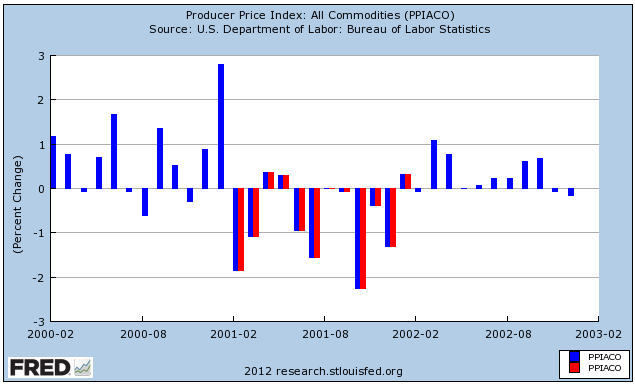
First let's do that with the 2001 recession, which ended in November 2001, and producer prices. The year during which YoY comparisons were almost uniformly weaker is shown in red. So note, for example, that the last red line (January 2002) shows less inflation than January 2001, but the next month (February 2002) shows more inflation than than February 2001.
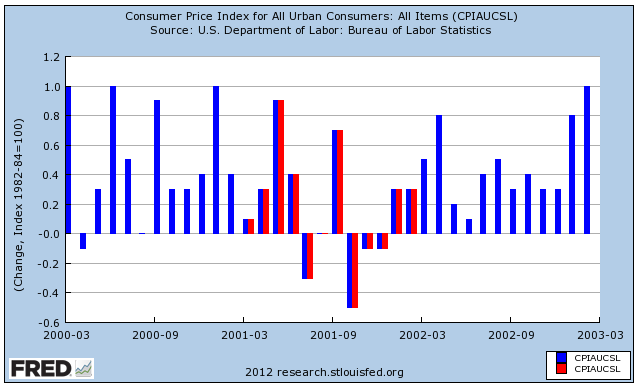
Next let's look at the 2001 recession and consumer prices. Notice that we get the same pattern:
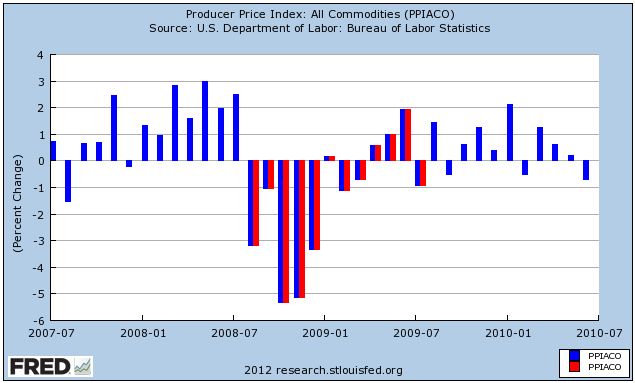
Next let's look at the 2008-09 Great Recession, and producer prices. Note the same pattern, with the last red line representing July 2009, one month after the recession, showing less inflation than July 2008. August 2009, the first blue line thereafter, shows more inflation than August 2008.
Next, here are consumer prices for the Great Recession. Again we get the same pattern:
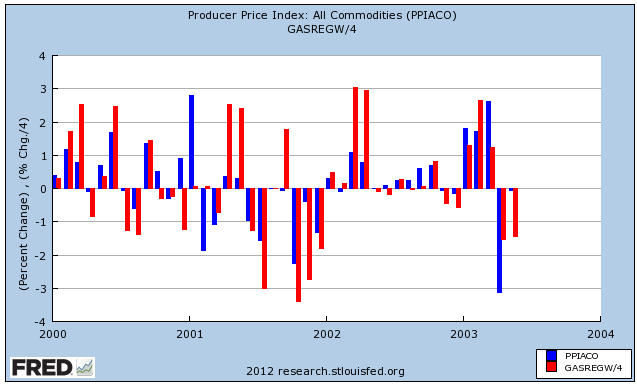
One reason I harp on gasoline prices so much is that they are the primary driver of monthly changes in both producer and consumer inflation. Here are producer prices in the early 2000s (blue) compared with the changes in gasoline prices (red) (again, I've scaled down gasoline price changes simply to better show the comparison):
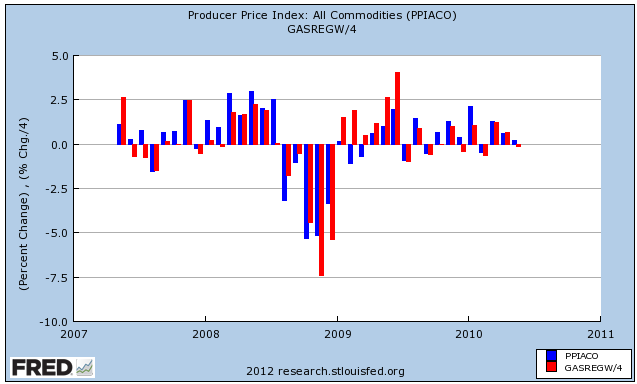
Here they are for the time leading up to, during, and right after the Great Recession:
And here they are since the beginning of 2011:
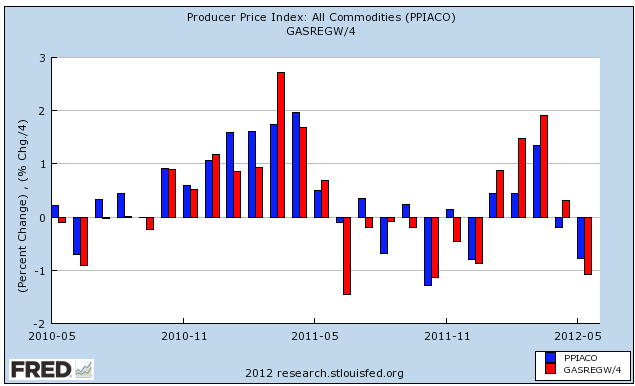
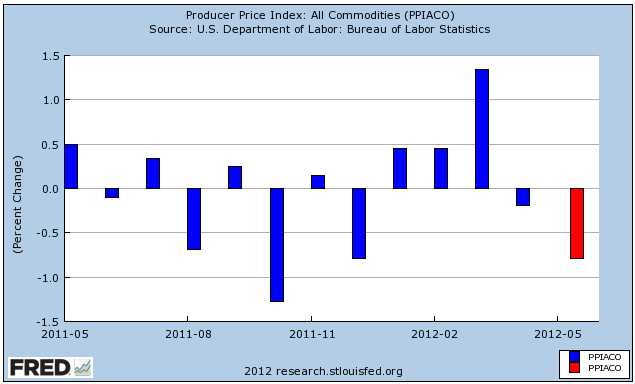
Keeping in mind that gasoline prices have been the main driver of the rate of change in inflation, here are producer prices for the last 2 years:
and here are consumer prices:
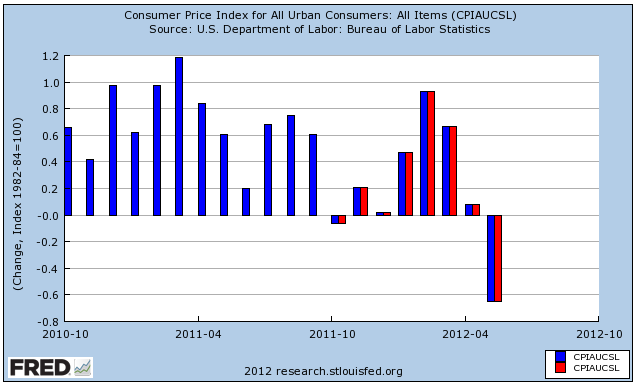
The red lines in both above graphs represent those months in which YoY inflation has been decreasing.
Barring a Lehman Brothers type catastrophe, I can't see deep deflation continuing for the rest of the year. That would require a decline of more than 10% further in gas prices to take us under $3.00/gallon for a national average, and that means about $60 a barrel for Oil. If that isn't going to happen, then the YoY comparison is going to start turn positive by about September, and based on past patterns that means the weakness bottoming out some time this summer, and stronger growth resuming thereafter.