- by New Deal democrat
Here are five economic graphs that I think are going to prove dispositive today.
First of all, Gallup economic confidence:
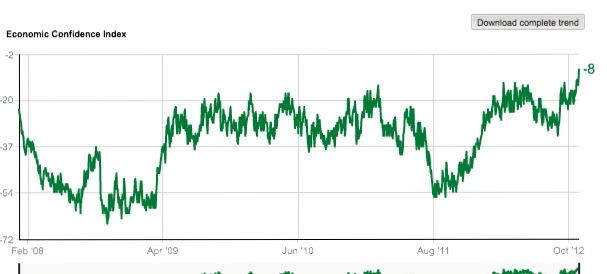
Note the sudden and dramatic upturn in the last couple of months, to the highest reading since the Great Recession began back in 2008.
Second, University of Michigan consumer sentiment:
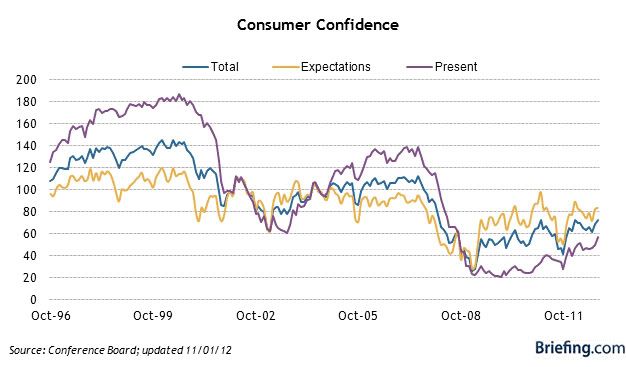
This confirms the recent upswing in average Americans' belief that the economy is healing.
Third, the employment to population ratio among 25 to 54 year olds:
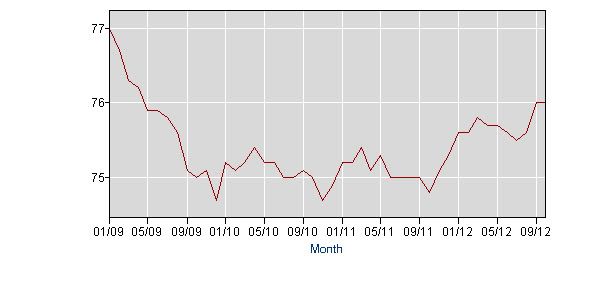
One reason for the upswing in confidence may be that population adjusted employment in the critical voting age group has finally borken out of flatlining. Note that this too, which excludes retiring Boomers, has finally had an upswing since the end of last year and is clearly at a post-recession high.
Fourth, Case Shiller house prices:
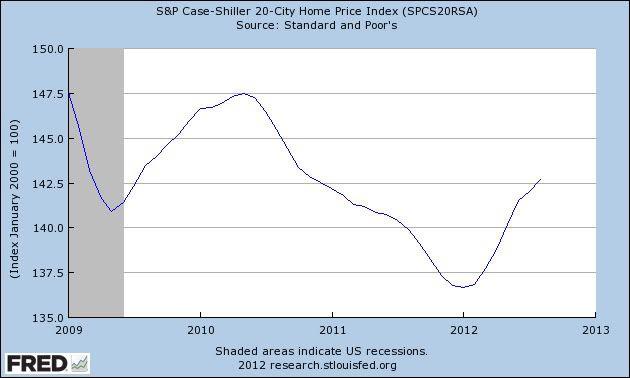
Another important reason for the upswing in confidence may well be that Americans are finally satisfied that the value of their houses isn't continuing to plummet, and at least a little equity is being clawed back.
Finally, the unemployment rate:
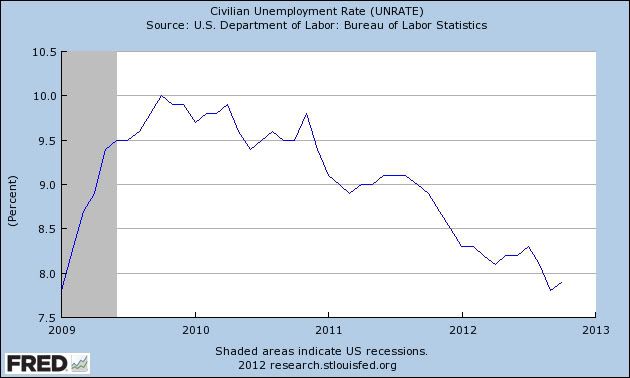
The unemployment rate has slowly but steadily declined for three years, finally breaking under 8% a month ago.
When I saw the 7.8% unemployment rate a month ago, I wrote that democrats could stop wringing their hands, Obama would win. I knew he was smart enought not to repeat his somnolent performance in the first debate, and it would fade as a story in the month remaining before the election. Meanwhile, the five above graphs show that Obama's economic performance has been just good enough to push him over the finish line.