Saturday, April 14, 2012

Weekly Indicators: I give up, you figure it out edition

- by New Deal democrat

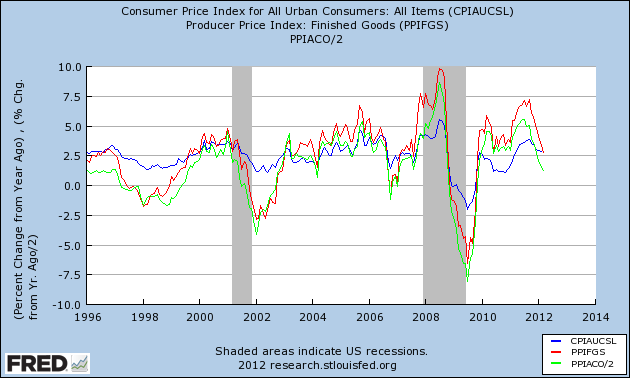
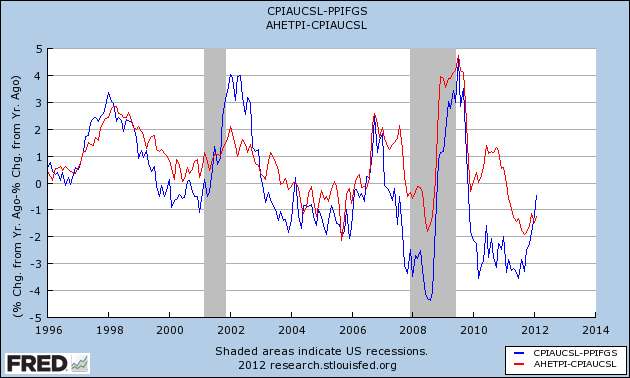
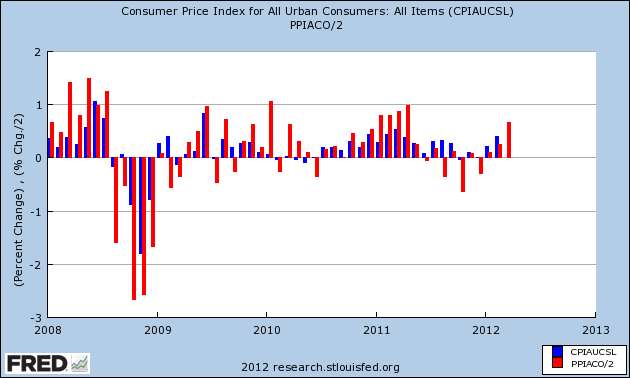
The monthly data releases this week showed that consumer, producer, and commodity inflation were all abating. All three were now running within .1% of 2.7% YoY. Commodity prices, which had rising at as high a rate as 11% YoY last July, were declining fastest. The first consumer confidence reading for April came in a little light.

This week the high frequency weekly indicators strongly contradicted one another. Let's start with the biggest negatives.

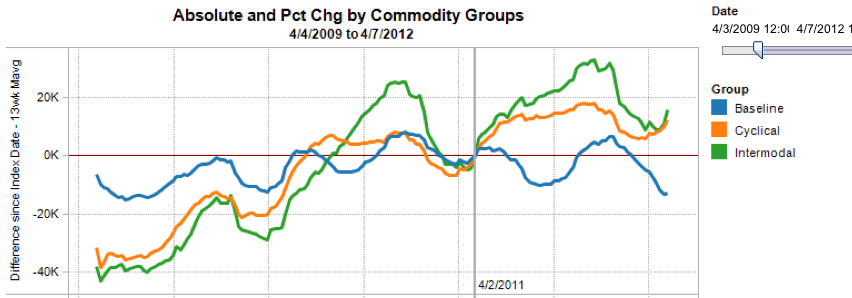
Rail traffic remained negative, and this week there was no good rationalization.

The American Association of Railroads reported a 4% decline in traffic YoY, or -20,200 cars. This week could not be blamed on coal, as even without coal, overall traffic edged up by a mere 800 cars, or +0.2% YoY. Intermodal traffic was up 2500 carloads, or +1.1%, but other carloads decreased -22,600, or -7.7% YoY. Railfax's graph of YoY traffic remained positive but deteriorated further this week. Oddly, Railfax's data shows that all of the decline is in "baseline" materials; rail hauling of cyclically sensitive materials remains in strong improvement.


Employment related indicators were strongly contradictory:

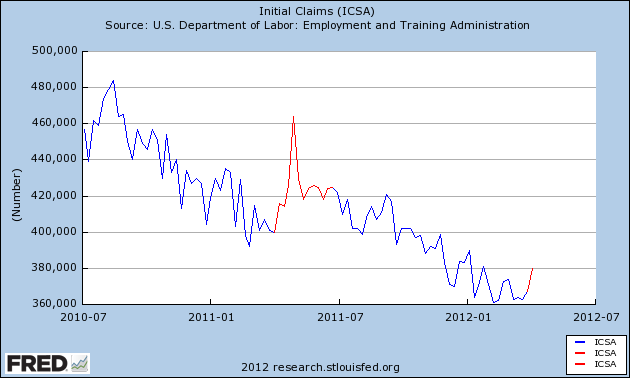
The Department of Labor reported that Initial jobless claims surged 23,000 to 380,000 last week, the highest report since January, mirroring the big increase in the first week of April one year ago. The four week average also rose by 6750 to 368,500.

The Daily Treasury Statement showed that for the first 9 days of April, $65.0 B was collected vs. $65.5 B a year ago, an absolute decline. In the last 20 reporting days, however (a more valid measure), $141.7 B was collected vs. $121.9 B a year ago, an increase of $19.8 B, or +16.2%!

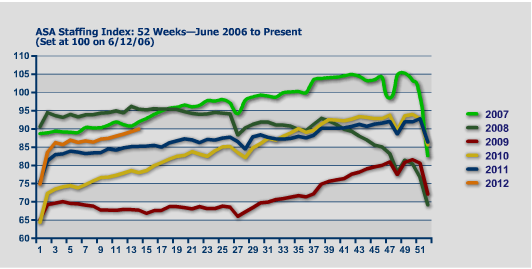
The American Staffing Association Index rose again by one to 90. It is now rising quickly, and is very close to its pre-recession readings of 2007. Should it continue at this pace, it will reach an all time high by June sometime.


Housing reports had a generally positive week:

The Mortgage Bankers' Association reported that the seasonally adjusted Purchase Index decreased -0.5% from the prior week, but was up a strong +5.5% YoY. The Refinance Index decreased another -3.8% from the previous week. Because the MBA's index was substituted for the Federal Reserve Bank's weekly H8 report of real estate loans in ECRI's WLI, I've begun comparing the two. This week for the second week in a row, and for the first time in four years real estate loans held at commercial banks were up, +0.2% on a YoY basis. On a seasonally adjusted basis, these bottomed in December and are now up +1.3% .

YoY weekly median asking house prices from 54 metropolitan areas at Housing Tracker were up +3.8% from a year ago. This number peaked at over +4% in February, but has now remained positive for 4 1/2 months. Via Calculated Risk, we are told that the NAR is likely to report a 3% YoY increase in median home sale prices for March. We should know by sometime this summer whether the Case-Shiller index follows the upward turn in the other indexes.

Sales were once again surprisingly positive.

The ICSC reported that same store sales for the week ending April 7 rose +0.9% w/w, and also rose +4.5% YoY. Johnson Redbook reported a 4.1% YoY gain. Shoppertrak reported a whopping 20.7% YoY gain having everything to do with the timing of Easter. The 14 day average of Gallup daily consumer spending remained high at $76, $10 above the equivalent period last year.

Money supply was also positive:

M1 rose +1.1% last week, and was also up +0.8% month over month. On a YoY basis it declined slightly to +17.5%, so Real M1 is up 15.1%. YoY. M2 was up +2.2% for the week, and also up +0.5% month over month. Its YoY advance fell slightly to +9.8%, so Real M2 was up 7.2%. Real money supply indicators continue slightly less strongly positive on a YoY basis, although not so much as in previous months. It has resumed rising slightly on a month over month basis.

Bond prices were mixed and credit spreads widened slightly:

Weekly BAA commercial bond rates rose +.04% t0 5.29%. Yields on 10 year treasury bonds fell +.06% to 2.21%. The credit spread between the two, which had a 52 week maximum difference of 3.34% in October, rose slightly again to 3.07%. There has been a very slight weakening in this measure in the last two weeks.

The energy choke collar remains engaged:

Gasoline prices were flat at $3.94, the first week in months that there was not any increase. Oil was down slightly at $102.83. Both of these remain above the point where they can be expected to exert a constricting influence on the economy. Gasoline usage, at 8681 M gallons vs. 9181 M a year ago, was off -5.4%. The 4 week moving average is off -4.0%. These are among the best comparisons in months.

Turning now to high frequency indicators for the global economy:

The TED spread fell .02 to 0.380. This index remians slightly below its 2010 peak, generally steady for the last 7 weeks, and has declined from its 3 year peak of 3 months ago. The one month LIBOR declined .001 to 0.240. It is well below its 12 month peak set 3 months ago, remains below its 2010 peak, and has returned to its typical background reading of the last 3 years.

The Baltic Dry Index at 972 was up 44 from 928 one week ago, and up 302 from its 52 week low, although still well off its October 52 week high of 2173. The Harpex Shipping Index was flat at 395 in the last week.

Finally, the JoC ECRI industrial commodities index fell from 124.26 to 123.74. It has resumed its fade, at a pace about equal to April one year ago. This indicator appears to have more value as a measure of the global economy than the US economy.

This week we got some strongly contradictory signals from our high frequency indicators. Rail traffic, initial claims, industrial commodity prices and credit spreads all showed weakness. Three of these happen to be components of ECRI's WLI, so it is no surprise that it fell last week, although its 6 month growth metric continued to be more positive.

On the other hand, withholding taxes, temporary staffing, sales, housing, and money supply are all positive, some strongly so. Several of these are also leading indicators.

My best guess is that we are replaying last year, where seasonal increases in gasoline prices in the first part of the year cause the Oil choke collar to tighten, and weaknesses to appear in a number of indexes. I suspect this weakness will last until about midyear, and lead to the same double-dippism we heard in 2010 and 2011. This year might even be slightly worse. The weakness will cause the Oil choke collar to loosen, and the economy will become "surprisingly strong" as we head towards the end of the year.

Friday, April 13, 2012

Weekend Weimar, Beagle and Pit Bull

It's that time of the week. Think about anything except the markets and the economy. NDD will be here tomorrow with his weekly indicators. All of us will be back on Monday. Until then .....


1955: Employment

Let's start with a look at the overall level of unemployment:


Remember that in the 1950s, the economy was operating at a very high capacity.  In addition, the economy as far less automated.  As a result, we see a very low unemployment rate -- dropping from 4.9% at the beginning of the year to 4.2% by year's end.


All three sectors of the economy -- manufacturing, service and government employment -- saw increases.  The manufacturing sector was growing because of the mammoth increase in consumer demand -- hence the increase of nearly 1 million jobs.  As households were formed -- and as incomes increased -- the demand for services naturally increased as well.  This explains the increase of over 1 million service jobs over the year.  And finally, the decrease in government employment at the beginning of the year was the result of the end of the Korean War.  However, by year end, the increased demand for government services (education, public works etc..) led to an increase in government employment.

The above chart from the Economic Report to the President, shows a nice slice of population, employment and unemployment.

As for wages, the level of employment led to strong wage growth:


The Federal Reserve Described the Situation Thusly:


The chart below (from the ERP) graphically depicts hours worked and wages.


The weakness begins

- by New Deal democrat

With the release of producer and consumer inflation figures yesterday and today, it is safe to say that the period of maximum weakness forecast by the downturn in the long leading indicators over a year ago has begun. Notice I didn't say "recession." Neither the increase in initial claims yesterday, nor the inflation data, causes me to re-think that position I just re-examined within the last month (a period of weakness now, followed by relative strength later in the year). But weak data is likely to persist for several months at least.

First, let's briefly look at initial jobless claims. Prof. Dean Baker says not to panic, the increase is due to the non-winter winter distorting seasonal patterns.

That may be true, but on the other hand, there may be a different seasonality at work. The below graph includes the last 2 years of claims, and highlights April through June last year and claims since April 1 of this year in red:


It may be that the recent re-jiggering of seasonal adjustments was incomplete, or it may reflect increased layoffs due to the seasonal increase in gasoline prices tightening the choke collar on the economy.

Next, let's examine commodity, producer, and consumer prices. What is noteworthy is that, after a period of heightened commodity and producer price inflation, those are now declining on a YoY basis to the point where they are equal to or below consumer inflation. As of today, YoY CPI is +2.7%. YoY Commodity inflation is now +2.6%, and producer prices YoY are +2.8%. In the past, as I will describe more below, when the rate of commodity and producer price inflation goes from higher than to lower than consumer inflation, it has almost always coincided with weakness.

The inflation data isn't leading, it is coincident. But by examining the last few periods of weakness, we can get a very good idea how long it is likely to persist. (Note: the graphs below do not include this morning's CPI data).

First of all, here's a look at YoY consumer prices (blue), finished producer prices (red) and commodity prices (light green) since 1996 (note: I've divided the change in commodity prices by 2 for better scale only):


Notice that there have been 4 periods of relatively weak commodity and producer prices since 1996. Notice further that just prior to both recessions since then, commodity and producer prices ran much hotter than consumer prices. They crossed consumer prices about 1/3 of the way into each recession, and each recession ended when YoY commodity and producer price changes were at their lowest. This by the way is also exactly the pattern for the pre-WW2 deflationary recessions, including both the Great Contraction of 1929-32, and the Recession of 1938. That YoY commodity and producer price changes have now become weaker than YoY consumer prices tell us we have entered the period of maximum weakness.

In the next few graphs, I've subtracted producer prices from consumer prices. Thus a negative reading is a period when producer prices are growing faster than consumer prices. In the first, these are compared with YoY GDP (red):


Negative readings don't always mean negative GDP (remember the importance of consumer debt refinancing at lower rates). But when producer and commodity prices suddenly become weaker than consumer prices, at minimum a bout of weakness (1998, 2002, 2006) if not recession (2001, 2008) follows.

Next is the same relationship, except that the comparison is with quarterly changes in GDP:


When we make this substitution, we get a noisier relationship, but on the other hand you can see that quarterly GDP changes track the relative weakness or strength of consumer vs. producer prices very closely, as in only one or two quarters later.

Since it is weakness in inflation-adjusted wages that in part triggers the economic weakness, next let's compare real wages (red) with producer vs. consumer prices:


Note that once again, while there is noise, the two tend to move in tandem. Thus as producer prices weaken, we should expect to see real wages improve.

How long will the weakness last? As I've repeated above, the weakness bottoms almost exactly when producer and commodity prices are at their YoY weakest. That isn't as difficult to predict as it may seem. In each of the 4 periods of relative weakness since 1996 shown in the first graph above, the weakest point came within one month of exactly one year after the highest monthly producer and commodity price reading. The last 5 years of commodity (red, dividing by 2 for scale) vs. consumer (blue) price changes are shown in the bar graph below:


In 2008, the last strongly inflationary month was July. Barring a deflationary spiral, it wasn't too difficult to foresee that the maximum YoY reading in commodity prices would be July 2009. Based on past deflationary recessions, including the Great Depression, that meant the "Great Recession" was likely to bottom in about that month. That was a strong contributing factor in my ability to foresee when that recession would bottom in advance.

In 2011, the last strong inflationary month was April. Unless there is a severe recession, it is unlikely that YoY commodity prices will continue to decline after July, or September at the latest. Better real wages and improving business profitability caused by the greater decline in commodity prices should assert themselves beginning at that time. That means this period of weakness should start to abate sometime during the summer -- i.e., too short and too shallow to be considered a recession.

Morning Market Analysis


The SPYs sold off to the 136 level -- a total drop of only 4.4% from the 142 area.  Prices gapped higher yesterday, fluctuating around the 137 level, but rallied today from the 137 to the 139 level. 


The daily chart shows that prices hit resistance at the 10 and 20 day EMAs.  Assuming the move through that level, we see resistance in the 141 and 142 areas.


The QQQs are in the same technical position.  However, it's fairly standard to see prices hit previous trend lines and stall.  That means the mid-December - early April trend line a very important technical event.


The entire treasury curve has rallied: the IEIs have moved from 120 to 121.8 (+1.5%); the IEFs from 101.5- 104.5 (3%) and the TLTs from 110-115 (4.5%). 

So -- we have a weak equity market that, so far, is rallying technically; that is, traders are looking at the charts and saying, "we're over-sold; let's buy some cheap equities.:  The treasury market is catching a safety bid.

Let me highlight two other markets that should concern you:


The Italian market has moved from a high of 14 to 12.07 -- a drop of 14%.


The Spanish market has dropped from a high of 33 (early February) to 27.16 -- a drop of 17.69%.  Also note that prices are hitting resistance at lows established in late November.

Thursday, April 12, 2012

Beige Book Summary

The Federal Reserve Released the Beige Book yesterday.  This is one of my favorite documents, as it provides a near real-time anecdotal analysis of the US economy.  Below is the complete summary page.  Each Fed region also has a summary.  I highly recommend reading at least the passage below.

Begin excerpt from the Beige Book:

Reports from the twelve Federal Reserve Districts indicated that the economy continued to expand at a modest to moderate pace from mid-February through late March. Activity in the Boston, Atlanta, Chicago, Dallas, and San Francisco Districts grew at a moderate pace, while Cleveland and St. Louis cited modest growth. New York reported that economic growth picked up somewhat. Philadelphia and Richmond cited improving business conditions. The economy in Minneapolis grew at a solid pace and Kansas City's economy expanded at a faster pace.

Manufacturing continued to expand in most Districts, with gains noted in automotive and high-technology industries. Manufacturers in many Districts expressed optimism about near-term growth prospects, but they are somewhat concerned about rising petroleum prices. Demand for professional business services showed modest to strong growth and freight volume was mainly higher. Reports on retail spending were positive, with the unusually warm weather being credited for boosting sales in several Districts. While the near-term outlook for household spending was encouraging, contacts in several Districts expressed concerns that rising gas prices could limit discretionary spending in the months to come. New-vehicle sales were reported as strong or strengthening across much of the United States. Tourism increased in most reporting Districts.

Residential real estate showed some improvement, with many contacts citing expansion in the construction of multi-family housing. Activity in nonresidential real estate increased or held steady in most Districts. Agricultural conditions were generally favorable. Mining activity expanded and oil extraction rose, while natural gas drilling slowed. Banking conditions were largely stable, with some improvement seen in loan demand. Several Districts reported increased credit quality.
Hiring was steady or showed a modest increase across many Districts. Difficulty finding qualified workers, especially for high-skilled positions, was frequently reported. Upward pressure on wages was constrained. Overall price inflation was modest. However, contacts in many Districts commented on rising transportation costs due to higher fuel prices.

Manufacturing

Manufacturing continued to expand in most Districts, although respondents in the Boston and St. Louis Districts reported that manufacturing was mixed and Chicago reported that growth in manufacturing production leveled off after a strong start to the year. Contacts in automotive industries reported gains in Cleveland, Atlanta, and Chicago. The Kansas City, Dallas and San Francisco Districts reported increased sales for high-technology manufacturers, with Dallas noting key demand drivers continue to be mobile applications, cloud computing, and automobiles. The Philadelphia and Dallas Districts indicated improvement in demand for manufacturing with ties to residential housing and construction. Cleveland steel producers and service centers reported that volume was trending slightly higher, while Chicago steel producers said that capacity utilization was steady. For refiners in San Francisco, capacity utilization rates continued to hold largely stable, as weak domestic gasoline demand was offset by strong foreign demand for distillate products. In Dallas, Gulf Coast refiners noted steady margins overall.

Manufacturers in Boston, Cleveland, and Chicago are expanding payrolls but finding it difficult to find highly-skilled workers. Comments from the Cleveland, Atlanta, Chicago, and Kansas City Districts indicated a rise in capital spending. Manufacturers in over half the Districts commented on increasing input costs, focusing, in particular, on rising petroleum prices. Contacts in Boston, Philadelphia, Chicago, Kansas City, and San Francisco remained optimistic that activity will increase in the near term. However, several respondents in Cleveland and Dallas noted that their outlooks have become more cautious. Manufacturers in Boston and Cleveland expressed concern about the European economy. Expectations were mixed in St. Louis.

Nonfinancial Services

Demand for professional business services was characterized as modest to strong in the Boston, Philadelphia, Richmond, Kansas City, and Dallas Districts. St. Louis, Minneapolis, and San Francisco reported that demand was mixed. Boston and Richmond cited rising demand for advertising, marketing, and consulting services, while accounting services saw a modest pickup in Minneapolis and Dallas. Growth in technology-related services to the energy sector was noted in the Minneapolis and Kansas City Districts. St. Louis and San Francisco reported that activity in the healthcare sector was flat to down. Both Richmond and San Francisco noted increased sales for restaurants and food-related service providers. Freight transportation services were higher in the Cleveland, Richmond, and Kansas City Districts. Reports from Atlanta and Dallas were mixed due to declining air cargo volumes and railroad shipments. St. Louis reported that plans have been announced to close certain freight transport and distribution facilities. Contacts in Cleveland, Richmond, and Kansas City noted a shortage of qualified truck drivers.

Consumer Spending and Tourism

Retail spending continued to improve in almost all Districts. Contacts in the Boston, New York, and St. Louis Districts characterized retail activity as strong. Reports from Chicago and Richmond indicated a significant strengthening in retail spending. Sales expanded at a modest or moderate pace in Philadelphia, Minneapolis, Kansas City, and Dallas. Unseasonably warm weather boosted sales in the Boston, Philadelphia, Cleveland, Richmond, and Chicago Districts. Grocers in Cleveland and San Francisco reported sales as unchanged. Apparel sales were strong in Boston and New York. Purchases at home improvement stores were up in Richmond and Chicago. Reports from Boston, Atlanta, St. Louis, and Kansas City indicate a positive near-term outlook for retail spending; however, contacts in Philadelphia, Cleveland, Atlanta, Chicago, and Kansas City expressed concerns that rising gas prices could limit discretionary spending in the months to come.

Automobile sales were reported as stronger or strengthening during late February and early March in most Districts. Mild winter weather boosted sales in Cleveland but depressed motor vehicle service spending in New York and Minneapolis. Rising gas prices lead to increased purchases of fuel-efficient vehicles in Kansas City, Dallas, and San Francisco. Contacts in Philadelphia and Kansas City expect continued sales strength. Reports from Cleveland showed a mixed outlook, with some respondents expecting solid sales and others seeing the current pace of sales as unsustainable. Used-vehicle sales were reported as strong or robust in Cleveland and San Francisco.

Tourism was characterized as strong by respondents in the Boston, New York, Richmond, and Atlanta Districts. Minneapolis indicated a slowdown in activity due to a general lack of snow this winter. Conversely, warm weather boosted tourism in Richmond. Bookings were strong in New York, and occupancy rates improved in the Boston, New York, Atlanta, and San Francisco Districts. In Boston and Kansas City, business travel continues to be the main driver of tourism activity. Contacts in Boston and Atlanta expressed concern over high fuel prices as a possible drag on leisure spending.

Real Estate and Construction

Residential real estate activity improved in most Districts, though Cleveland and San Francisco noted that activity remained lackluster or at low levels. The St. Louis and Minneapolis Districts reported increases in building permits. The construction of multi-family housing units, including apartments and senior housing, expanded in many Districts. Home prices continued to decline in Boston, New York, and Minneapolis, but were largely flat in San Francisco. Contacts in Boston, Philadelphia, and Kansas City indicated that mild weather had boosted real estate activity.

Non-residential construction activity improved in the Philadelphia, Cleveland, Richmond, Atlanta, Chicago, and St. Louis Districts, though many of these contacts characterized the improvement as slow. Boston, New York, and San Francisco characterized non-residential real estate activity as unchanged or steady. The energy and high-tech sectors were driving much of the demand in the Dallas District. San Francisco noted a rise in the demand for office space from the technology sector. Cleveland and Chicago saw a boost in healthcare-related construction. Projects related to the education sector are showing growth in Boston, Cleveland, Philadelphia, and Richmond. The outlook of builders is described as positive or slowly improving in the Philadelphia, Cleveland, Atlanta, and Kansas City Districts, and as cautiously optimistic in Boston.

Banking and Finance

For most Districts reporting on financial services, banking conditions remained stable, with modest improvements in demand for lending. Loan demand was reported as improved in New York, Philadelphia, Cleveland, Richmond, Chicago, Kansas City, Dallas, and San Francisco, while lending activity was unchanged in St Louis. The Dallas District reported improved sentiment by national and regional banks due to improved middle-market and large corporate lending. Contacts in Cleveland, Richmond, and San Francisco reported that increased competition among lenders has been driving more aggressive loan pricing. In general, the demand for commercial and industrial loans remained steady, while several Districts reported an increase in commercial real estate lending activity. The Philadelphia and Cleveland Districts reported increased lending for multifamily housing and health care, and contacts in Richmond cited increased lending to small business to finance inventory and capital expenditures. Consumer lending has remained stable or risen modestly across a few Districts. The Cleveland and Richmond Districts reported increased home equity and auto lending, while bankers in Chicago noted improved credit availability for auto loans and credit cards. Several Districts reported that credit standards remain stable, but Richmond bankers reported that they were offering easier terms to attract new commercial borrowers. Several Districts reported increased credit quality, as delinquencies have continued to decline and few problem loans have been reported.

Agriculture and Natural Resources

Recent rain and snowfall has helped alleviate dry agricultural conditions from earlier in the year. Nonetheless, the Atlanta, Minneapolis, Kansas City, and Dallas Districts have all reported certain areas where drought conditions continue to persist. Due to unseasonably warm weather, contacts in several Districts reported that the planting of some crops is beginning earlier than normal, including corn in Chicago and wheat in Minneapolis. San Francisco commented that there has been an increase in certain input costs, such as fertilizer, while Chicago reported tight supplies of some agricultural chemicals and corn seed. Atlanta and Chicago reported an increase in the prices paid to farmers for soybeans; Chicago noted that the increase was due to lower-than-expected harvests in South America. Livestock prices rose in the Chicago, Minneapolis, and Kansas City Districts, while orders for livestock were robust in San Francisco. Farmland values in Kansas City continue to rise and are at record highs.

Activity in natural resources remained strong. The Kansas City, Dallas, and San Francisco Districts reported a shift from natural gas to oil exploration and production due to low natural gas prices and growing demand for oil. In the Cleveland District, leasing activity in the Utica shale is expanding. Cleveland and St. Louis noted that the production of coal has slowed over the past few months. The mining sector is expanding in San Francisco due to high prices for a variety of precious metals, and iron ore mines in the Minneapolis District continued to operate near capacity. Contacts in Kansas City reported a shortage of engineers and experienced technical support for oil and gas drilling.

Employment, Wages, and Prices

Hiring was steady or showed a modest increase in the Boston, New York, Cleveland, Richmond, Atlanta, Chicago, Minneapolis, Dallas, and San Francisco Districts. Industries reporting some employment growth included manufacturing, freight transport, professional business services, and information technology. A preference for part-time and temporary workers was seen in the Richmond and Atlanta Districts. Atlanta noted that temporary workers were being utilized in order to contain costs and retain flexibility, while some employers in Richmond prefer temporary workers due to uncertainty about future demand. Some employers in the Boston, Cleveland, Atlanta, Chicago, Kansas City, and Dallas Districts reported having difficulty finding qualified workers, especially for certain high-skilled positions. Contacts in Philadelphia and Cleveland noted that new federal regulations are exacerbating a truck-driver shortage. New York commented that employers are planning to step up hiring activity in the months ahead. Boston, Richmond, and Atlanta said that employers in their Districts are cautious and need to see more robust growth before they expand their permanent payrolls further.

Wage pressures were characterized as contained or modest among reporting Districts. Contacts in Chicago, Dallas, and San Francisco noted some upward pressure on wages for skilled jobs, especially in manufacturing and information technology. In the Minneapolis District, strong oil-drilling and production activity continued to bid up pay. Transportation contacts in Cleveland noted some wage pressure due to a tightening of the driver pool. And medical benefits continue to put pressure on labor costs in Philadelphia.

Overall price inflation was modest in most Districts. However, contacts in the Cleveland, Richmond, Atlanta, Chicago, Kansas City, and Dallas Districts cited rising transportation costs due to higher fuel prices. Minneapolis and Dallas noted that airlines have raised their fares to offset higher fuel costs. Richmond reported that rising fuel costs were a serious problem for both land and ocean shippers, while intermodal transportation firms in Dallas said that they had increased prices in response to higher fuel costs. In Atlanta, higher transportation costs were passed through to consumers without much difficulty. In contrast, contacts in Cleveland, Chicago, and San Francisco said it was difficult to pass through higher costs to consumers. Input costs for manufacturers in Boston, Cleveland, and Kansas City rose somewhat, but with little pass-through. Price pressures have eased somewhat for manufacturing firms in Philadelphia. Higher prices for construction materials narrowed profit margins for contractors in Kansas City.


1955: Industrial Production

This post is part of the Bonddad  Economic History Project.  For more information, please see the right side of the blog

In 1955, the US was an island in the world.  Countries that would eventually become our international competitors were still rebuilding from WWII.  As such, the explosion in consumer demand was satiated by goods produced domestically.  Consider the following table of consumer goods:

US consumer demand was booming; US industry was the primary source of goods sold to US consumers.  As such, we see that overall industrial production rose for 1955:


The top chart shows that overall IP was at record levels in 1955.  The second chart shows that total mineral production was the first sector to hit multi-year highs.  But by the end of the year, durable, non-durable and total manufacturers production had reached multi-year levels.


The above table puts the charts into numerical perspective, as does the following excerpts from the Federal Reserves Annual Report and the Economic Report to the President, 1956.


The EU's Dilemma

Last week, the head of the European Central Bank gave a press conference.  I want to focus on his opening statements to paint a general picture of the EU right now.
Based on our regular economic and monetary analyses, we decided to keep the key ECB interest rates unchanged. The information that has become available since the beginning of March broadly confirms our previous assessment. Inflation rates are likely to stay above 2% in 2012, with upside risks prevailing. Over the policy-relevant horizon, we expect price developments to remain in line with price stability. Consistent with this picture, the underlying pace of monetary expansion remains subdued. Survey indicators for economic growth have broadly stabilised at low levels in the early months of 2012, and a moderate recovery in activity is expected in the course of the year. The economic outlook remains subject to downside risks.

Medium-term inflation expectations for the euro area economy must continue to be firmly anchored in line with our aim of maintaining inflation rates below, but close to, 2% over the medium term. Over the last few months we have implemented both standard and non-standard monetary policy measures. This combination of measures has contributed to a stabilisation in the financial environment and an improvement in the transmission of our monetary policy. We need to carefully monitor further developments. It is also important to keep in mind that all our non-standard monetary policy measures are temporary in nature and that all the necessary tools are available to address upside risks to medium-term price stability in a firm and timely manner.
The ECB is facing two, inter-related problems.  The first is inflation.   Here is a chart of the annual change in CPI for the euro area:


For a more complete picture of the EU area's inflation situation, see this inflation site on Eurostat.  However, this shows that inflation is one side of the EU's problem.

The second is economic growth.  Here is ECB president Draghi:
Let me now explain our assessment in greater detail, starting with the economic analysis. Real GDP contracted by 0.3% in the euro area in the fourth quarter of 2011. Survey data confirm a stabilisation in economic activity at a low level in early 2012. We continue to expect the euro area economy to recover gradually in the course of the year. The outlook for economic activity should be supported by foreign demand, the very low short-term interest rates in the euro area, and all the measures taken to foster the proper functioning of the euro area economy. However, the remaining tensions in euro area sovereign debt markets and their impact on credit conditions, as well as the process of balance sheet adjustment in the financial and non-financial sectors and high unemployment in parts of the euro area, are expected to continue to dampen the underlying growth momentum.


The above two charts show the other half of Draghi's problems.  Last quarter, EU growth contracted (the top chart).  This lead to an increase in unemployment (the bottom chart).  Ideally, the central bank would lower interest rates to spur lending growth as the primary way to deal with this situation.  However, rates are already at 1% and inflation is a threat.  Put another way, the ECB is between an economic rock and hard place from which there is no easy policy response.

Regarding inflation, Draghi stated the following:
Euro area annual HICP inflation was 2.6% in March 2012, according to Eurostat’s flash estimate, after 2.7% in the previous three months. Inflation is likely to stay above 2% in 2012, mainly owing to recent increases in energy prices, as well as recently announced rises in indirect taxes. On the basis of current futures prices for commodities, annual inflation rates should fall below 2% again in early 2013. In this context, we will pay particular attention to any signs of pass-through from higher energy prices to wages, profits and general price-setting. However, looking ahead, in an environment of modest growth in the euro area and well-anchored long-term inflation expectations, underlying price pressures should remain limited.
Or, "the only cure for high commodity prices is high commodity prices."  Draghi is hoping that high energy prices will stave off demand of energy products, thereby lowering energy prices.  Frankly, it's about his only option at this point.  


Morning Market Analysis: BRIC Correction and Commodity Weakness


After hitting the 110 price level in late February, oil has slowed moved lower.  It has moved through technical support at the 103.5 level and is now below the 50 day EMA.  The 10 and 20 day EMA are both moving lower and the 10 day EMA has crossed below the 50.  While the MACD and the CMF are both declining, we're not seeing a lot of movement on the A/D line.

The sell-off has been incredibly gentle -- especially considering the market is worried about global growth.  However, the slow and gradual technical deterioration -- especially as we get closer and closer to the summer driving season -- is very interesting.


The industrial metals ETF is at the 61.8% Fib level.  The shorter EMAs are all moving lower, and we see a bearish alignment (shorter below longer).  The MACD is declining as well.  The CMF is nearing 0, but the A/D is not super bearish.  But the big issue is that prices are below the 200 day EMA -- a bear market.  That does not bode well for the global economy.


UPDATE: I forgot to add this to the original post.  Cattle prices broke an uptrend that started in Mid-December and went to the end of March.  Since then, prices have continued to move lower, breaking support in the 29.75, 29.10 and 29 price level.  Also note the declining EMAs, MACD and volume indicators.  However, the MACD may be close to giving a buy signal.  However, my guess is that would turn into a technical rebound into an EMA or Fib level.

The above three commodity charts are bearish; they do not give us encouragement regarding the macro situation in the near term.


The Chinese market ETF is in a downward sloping pennant pattern, below the 200 day EMA.  We also see declining shorter EMAs.  The MACD is trying to turn bullish, and the A/D line is still bullish.  But, the real issue is prices are below the 200 day EMA.  Prices have moved from the 30.5 area to 36 -- a decline of a little over 10.5%.

 
The Russian market is in the exact same situation as the Chinese market -- a declining wedge with prices now below the 200 day EMA.  Here we see a decline of about 11% -- from 33.5 to 29.79.


After hitting a high of 62 in mid-February, prices in the Indian market have moved lower to 55.18 -- a decline of 11%.  Prices are below the 200 day EMA, momentum is negative (although the direction is neutral), but the volume indicators are positive.


The Brazil ETF has dropped from 70 to 61.83 -- a drop of nearly 12%.  The shorter EMAs are moving lower and prices are below the 200 day EMA.  Momentum is declining as well.

The BRIC charts are all down at least 10%.  That's a big move lower and indicates all is not well with the emerging world. 

Wednesday, April 11, 2012

What's Wrong With Italy?

Italy keeps coming up as a potential EU problem child.  Unfortunately, the financial press really hasn't given us any information on the topic.  However, the IMF has.  So, let's dig into the IMFs assessment of Italy, with some help from OECD and IMF statistics services. 

From the IMF:
1. The global economic crisis has hit a structurally weak Italian economy. Italy’s growth rate had already been slowing for over a decade, reflecting weakening productivity. Economic rigidities, along with Italy’s specialization in products with relatively low value added, have also been contributing to a steady erosion of competitiveness. Consequently, Italy has been losing its market share of world trade.
Form the US Department of State:
Italy has few natural resources. With much land unsuited for farming, Italy is a net food importer. There are no substantial deposits of iron, coal, or oil. Proven natural gas reserves, mainly in the Po Valley and offshore in the Adriatic, constitute the country's most important mineral resource. Most raw materials needed for manufacturing and more than 80% of the country's energy sources are imported. Italy's economic strength is in the processing and the manufacturing of goods, primarily in small and medium-sized family-owned firms. Its major industries are precision machinery, motor vehicles, chemicals, pharmaceuticals, electric goods, tourism, fashion, and clothing.
These two data points illustrate the central problem faced by Italy: they don't have something that everybody wants.  Compare these facts to, for example, Chile, which has copper or Saudi Arabia, which has oil.   Both of these countries can export a raw material.  In comparison, Italy doesn't have this advantage.  And, they aren't developing any goods/services that distinguish themselves from their competitors.


The above chart shows that aside from 4% growth at the beginning of the decade and slight move into the 3% range in 2007, Italy has been showing a very slow rate of growth for slightly over a decade.  This tells us that there is some type of  fundamental problem with the economy.

Let's look at some other stats:


Italian IP remained at the same level for 5 years, from 2001-2005.  It then rose to the 105 level for 2006-2008.  However, notice we see a huge drop in IP as a result of the recession with a slight rebound.  However, the overall level of IP has remained constant since mid-2010 -- not a good development.


Overall investment is also weak.  Here, we see the impact of weak industrial production.  Weak IP, means capacity utilization is weak, leading to low investment. 


Italian unemployment has been increasing since roughly the middle of 2011.


Real private PCEs are also in a negative spot.  After the recession, PCEs dropped, as would be expected.  However, starting at the beginning of 2009, we see PCEs start to increase.  However, in roughly mid-2011, PCEs drop.


  CPI has been rising on a YOY basis since mid-2009.


Finally, the balance of trade is getting worse.

To sum up the above information we get the following picture: Italy has experienced weak growth for the last 10 years.  They have not developed or created exports wanted by other trading partners, meaning the contraction of 2007-2009 was a very negative event for the economy.  The trade deficit has been increasing for the last ten years.  Italian consumers are not spending, lowering growth.  Overall investment is very weak.

To explain the debt situation we have the following facts.  First, consider the following chart of debt/GDP

And consider it in conjunction with this table of total Italian GDP:


Basically, Italy didn't do anything or not do anything.  Their growth dropped which lowered total GDP which led to an increase in the debt/GDP ratio.

Unfortunately, there aren't any bright spots in the Italian economy. From the IMF:
2. The global crisis affected the economy mainly through the trade, credit, and confidence channels. The recession in Italy’s main trading partners led to a sharp fall in exports. Although there was no fallout from the banking system, financing conditions tightened and credit growth fell. Despite strong household balance sheets, private consumption declined significantly, mainly reflecting higher uncertainty. Fixed investment and inventories also fell sharply, owing to weak demand prospects. The decision not to engage in a large fiscal stimulus (which was appropriate in view of the high level of public debt) meant that these effects on aggregate demand translated into one of the deepest output falls among large industrialized countries. However, unemployment rose only modestly, in large part thanks to the extension of the existing wage supplementation scheme (Cassa Integrazione Guadagni), and lower participation.

3. A modest and fragile recovery based on external demand, restocking of inventories, and some government support is now under way. As elsewhere in the industrial world, potential output in Italy may have been adversely affected by the crisis.

The slow recovery of Italy’s major trading partners and the significant competitiveness gap will limit export growth; the rise in non-performing loans and the need to shore up banks’ capital will constrain credit supply; rising unemployment will undermine private consumption; and investment will be limited due to financing constraints, low capacity utilization, and falling profitability.

4. Although the worst effects of the crisis have mostly passed, key vulnerabilities remain. The high private savings rate, low private indebtedness, and the resilience of the financial sector, are important elements of strength. However, the high level of public debt and the disappointing growth performance could make Italy vulnerable to external shocks. Debt management has been conducted prudently, by lengthening the maturity of public debt and building buffers. These efforts should help strengthen the government’s financial position. But they cannot be a substitute for a sustained fiscal consolidation.
Italy just doesn't have any good policy answers right now.