

The daily oil chart (top chart) shows that oil is still in the middle of a rally that started in mid-December. Prices have advanced through the 200 day EMA and has also pulled the 10 and 20 day EMA through that line. The MACD continues rallying and the CMF shows a strong move into the market. The next line of resistance is in the 97-98 price level. Most importantly, the weekly chart (lower chart) shows that prices have moved through the upper line of resistance in the consolidation triangle that started forming early next year. The big key to this chart is the MACD which, while negative, have given a buy signal.
It looks as though oil is getting ready to rally right as the summer driving season starts.


The daily euro chart (top chart) shows that the euro is near a six month high. It's been rallying since the beginning of August and is currently above the 200 day EMA. However, the MACD shows that momentum is dwindling, probably because prices are nearing resistance on the weekly chart (now chart). The euro started rallying mid-summer 2012 and is now in an area established by price movement in early 2012, when prices stayed in the 130-132.5 area for a few months. The MACD on the weekly chart shows a clear upward trend in momentum, which may pull the daily chart higher.

The technology sector is usually the area of the market the pulls stocks higher. However, thanks to Apple, this is not the case. This sector bottomed in mid-November and has been moving higher since. Currenly, prices are right at the 61.8% Gib level from the sell-off. They have advanced above the 200 day EMA with a good, bullish reading from the CMF. The only drawback is the MACD, which shows a weak momentum reading.


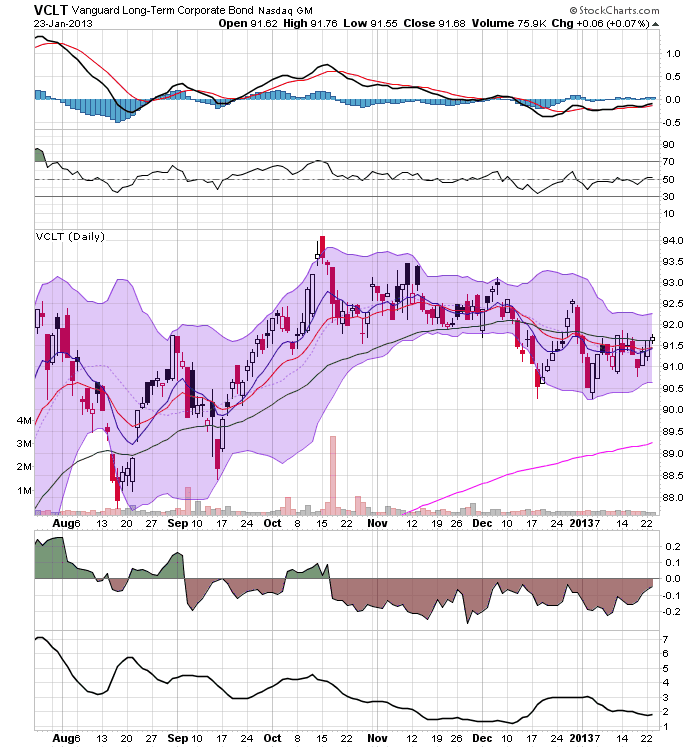
The corporate bond market is still in a generally strong position. The short end (top chart) and the intermediate sector (middle chart) have both broken trend, but are simply moving sideways now. The only weakness we're seeing is in the long end of the market (bottom chart) which is currently drifting lower, headed towards the 200 day EMA.