Saturday, September 12, 2015
Weekly Indicators for September 7 - 11 at XE.com
-by New Deal democrat
My Weekly Indicators post is up at XE.com. Despite global weakness, US domestic data remains decent.
Thursday, September 10, 2015
Forecasting 2014 Median household income
- by New Deal democrat
Next week the Census Bureau will release its report on 2014 median household income.
Since I have proposed that a reasonable and more up-to-date model for median household income of the 25-54 primary working age cohort is to take average hourly income and divide it by the percentage of those 25-54 who are employed (i.e., thier employment-poulation ratia), and then norm by inflation, I wanted to put out this forecast now, and we will see how it pans out next week.
The below graph gives two alternative values: red if the calculation is based on year-end values, and blue if the calculatioin is based on average values of the course of the year:

I believe the Census Bureau will use the average over the year, so the blue line is the more likely estimate. As you can see, it makes a considerable difference which way we measure.
I'm not pretending that this estimate is exact. As of 2013, the Census Bureau showed a decline of about 8% off the peak, whereas this estimate shows a maximum of 6% in 2011. But if my method works, we should see an increase in median household income in the prime working age group next week, as foreshadowed by the work of Prof. Emanuel Saez.
I'm not pretending that this estimate is exact. As of 2013, the Census Bureau showed a decline of about 8% off the peak, whereas this estimate shows a maximum of 6% in 2011. But if my method works, we should see an increase in median household income in the prime working age group next week, as foreshadowed by the work of Prof. Emanuel Saez.
Wednesday, September 9, 2015
JOLTS report warns job growth may be entering late cycle
- by New Deal democrat
I have a new post up at XE.com. The pattern of job openings, hires, and quits now looks very similar to what it was in summer 2006.
Monday, September 7, 2015
Five graphs for 2015: Labor Day update with 4 bonus graphs
- by New Deal democrat
At the end of last year, I highlighted 5 graphs to watch in 2015. We are now 8 months through the year, so let's take another look.
#5. Mortgage refinancing
After a mini-surge at the end of January (light brown in the graph below) due to low mortgage rates, refinancing applications fell back to their post-recession lows for most of the year. With another small decline in rates in the last 2 months, there has been a "minnier"-surge Mortgage News Daily has the graph:

Over the last 35 years, refinancing debt at lower rates has been an important middle/working class strategy. There is little room left for that strategy. As shown in the first bonus graph below that I first published over 3 years ago, if mortgage refinancing stays turned off too long, and wages don't grow in real terms, then consumer spending falters and so does the economy:

That three year anniversary is now 2 months away.
#4 Gas prices
Here is a graph of average hourly wages divided by gas prices (blue) since the bottom in gas prices in 1999:

#3 Part time employment for economic reasons
#4 Gas prices
Here is a graph of average hourly wages divided by gas prices (blue) since the bottom in gas prices in 1999:
How long must a worker labor in order to buy a gallon of gas? After skyrocketing in the lead-up to the Great Recession, gas prices collapsed, helping the consumer start to spend again on other things at the bottom of that recession. The steep drop in gas prices late last year took us almost all the way back to that bottom. Just as in 1986 and 2006, at first consumers saved the money, but once they loosened their pursestrings, the economy responded.
#3 Part time employment for economic reasons
Next is a graph of part time workers for economic reasons expressed as a percentage of the labor force. In the 8 months of this year, this continued to improve, down about .2% or 320,000:

In the longer view, however, this is still 2% (about 3.2 million) above the boom level of 1999 and about 1.5% (2.25 million) above the level of 2007:

Despite the solid improvement this year, there are still more involuntary part time workers than at any point between 1994 and 2008.
Our next bonus graph takes a broader view of full time vs. part time work, as a percentage of the labor force:

There has also been solid improvement in this comparison this year. We are now equivalent to where we were in 1996 and 2004. That isn't great, but it is no longer poor either.
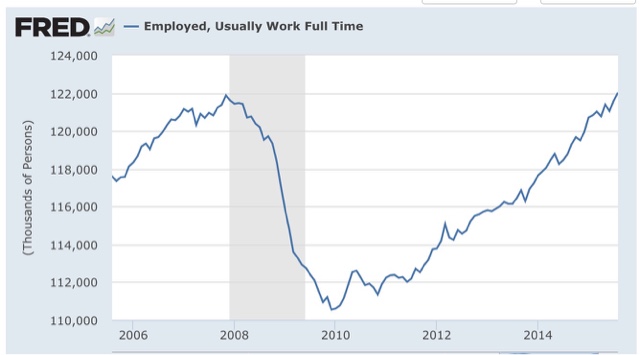
Our third bonus graph shows that the number of full time jobs have finally exceeded their previous high this past month:
#2 Not in Labor force but want a job now:
This moved generally sideways during the first quarter, but improved nicely in the last four months:
This moved generally sideways during the first quarter, but improved nicely in the last four months:

It is now only 200,000 above its post-recession low of November 2013 (just prior to Congress's cutoff of extended unemployment benefits) and about 1.5 million, or 1% of the workforce, above its 1999 and 2007 lows.
#1 Nominal wage growth
After 3 poor readings last August, December, and February, YoY growth in nominal wages for nonsupervisory personnel fell back close to their post-recession lows before rebounding this spring. Even so, YoY growth has been unable to crack 2% to the upside. In the below graph, I have s ubtracted 1.9% fromYoY nominal wage growth, and 10.3% fromcthe U6 unemployment rate, to set both to zero at their current levels:
After 3 poor readings last August, December, and February, YoY growth in nominal wages for nonsupervisory personnel fell back close to their post-recession lows before rebounding this spring. Even so, YoY growth has been unable to crack 2% to the upside. In the below graph, I have s ubtracted 1.9% fromYoY nominal wage growth, and 10.3% fromcthe U6 unemployment rate, to set both to zero at their current levels:

Compare our present expansion with the previous two. In the 1990s and 2000s, nominal wage growth started to accelerate when the broad U6 unemployment rate fell to 9.9% and 9.7% respectively.
Which brings us to the final bonus graph, a comparison of the U3 and U6 unemployment rates for the last 20 years, again with both values set to zero at their current 10.3% and 5.1% values:

The broad U6 unemployment rate has fallen at an average of -0.1% per month for the last 5 years. Should that continue, we will cross below 10% at the end of this year, implying nominal wage growth would finally accelerate early next year. Since at present inflation is still dead, one can only infer that the Fed's expressed desire to raise interest rates is designed to prevent any such wage growth.
In summary, eight months into the year we have a decidedly mixed bag. On the one hand, there has been no real improvement in either refinancing or wages. Should wage growth not improve, and mortgage refinancing remain dormant, we are likely to run into trouble - at least deceleratiing growth - probably starting next year.
On the other hand, low gas prices continue to be a boon to consumers. Further, involuntary part time employment has improved by about 300,000, and discouraged workers who have completely stopped looking have decreased by about 500,000. Thus, should those trends continue, I do expect wage growth to start to accelerate in about 3 to 6 months. Still, if current trends continue, we won't achieve real, full employment like 1999 or even 2007 for another 1.5 to 2.5 years!
Subscribe to:
Posts (Atom)